Understanding Probability: Concepts, Random Variables, and the Law of Large Numbers
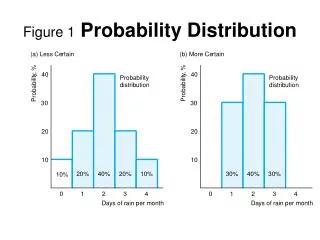
This content explores the fundamentals of probability, including the nature of probability statements, the unpredictability of single events, and how patterns emerge from random occurrences over time. It delves into the concept of relative frequency through examples like coin flips and dice rolls, illustrating how to calculate probabilities based on possible outcomes. It also introduces random variables, their long-term predictability, and the significance of the Law of Large Numbers in statistics. Discover how these concepts apply in real-world scenarios and change perceptions of randomness.


Understanding Probability: Concepts, Random Variables, and the Law of Large Numbers
E N D
Presentation Transcript
Probability - 1 Probability statements are about likelihood, NOTdeterminism Example: You can’t say there is a 100% chance of rain (no possibility of not having rain – i.e., a certainty, not a probability)
Probability - 2 • Flip a coin. Will it be heads or tails? • The outcome of a single event is random, or unpredictable. • What if we flip a coin 10 times? How many will be heads and how many will be tails? • Over time, patterns emerge from seemingly random events. These allow us to make probability statements.
Heads or tails? – The Relative Frequency Concept of Probability • A computer simulation of 10,000 coin flips yields 5040 heads. What is the relative frequency of heads? • 5040 / 10,000 = .5040
Each of the tests is the result of a sample of fair coin tosses. • Sample outcomes vary. • Different samples produce different results. True, but the law of large numbers tells us that the greater the number of repetitions the closer the outcomes come to the true probability, here .5. • A single event may be unpredictable but the relative frequency of these events is lawful over an infinite number of trials\repetitions.
Random Variables • "X" denotes a random variable. It is the outcome of a sample of trials. • “X,” some event, is unpredictable in the short run but lawful over the long run. • This “Randomness” is not necessarilyunpredictable. Over the long run X becomes probabilistically predictable. • We can never observe the "real" probability, since the "true" probability is a concept based on an infinite number of repetitions/trials. It is an "idealized" version of events.
To figure the odds of some event occurring you need 2 pieces of information: • A list of all the possibilities – all the possible outcomes (sample space) • The number of ways to get the outcome of interest (relative to the number of possible outcomes).
How Many Ways can Two Dice Fall? Let’s say the dice are different colors (helps us keep track). The White Dice could come out as: We know how to figure out probabilities here, but What about the other dice?
When the white die shows , there are six possible outcomes. • When the white die shows , there are six more possible outcomes. • We then just do that for all six possible outcomes on the white die
What is the probability of rolling numbers that sum to 4? • What do we need to know? • All Possible Outcomes from rolling two dice • (36--Check Previous Slide) • How many outcomes would add up to 4? Our Probability is 3/36 = .08333
Probability = Frequency of Occurrence Total # outcomes Frequency of occurrence= # of ways this one event could happen Total # outcomes= # ways all the possible events could happen Probability of a 7 is 6 ways out of 36 possibilities p=.166
Expected Frequency of the Sum of 2 Dice p = .167 6 .139 .139 5 .111 .111 4 F .083 .083 3 .056 .056 2 .027 .027 1 2 3 4 5 6 7 8 9 10 11 12 Sum of two dice
You Are Flipping 4 Coins • What are the chances of getting 2 heads and 2 tails? • Find the possible number of outcomes…
Histogram of Outcomes: X = Number of Heads HTTH HTHT HTTT THTH HHHT THTT HHTT HHTH TTHT THHT HTHH TTTT TTTH TTHH THHH HHHH ------- ------- ------- ------- ------- X = 0 X = 1 X = 2 X = 3 X = 4 OUTCOME 0 1 2 3 4 PROB .0625 .25 .375 .25 .0625 Divide the number of 2-head/2-tail outcomes by the number Of possible outcomes: 6/16 = .375
“THE LAW OF LARGE NUMBERS”: • ·If we observe a large number of outcomes of a random variable and then calculate the mean of this distribution, this random variable will increasingly come close to the true mean of the distribution. • The relative frequency increasingly comes to center on the true probability and eventually becomes stable. • Over many repetitions the sample mean is an unbiased estimator of the population mean, for coin tosses .5
Much of statistics is based of establishing the odds, the likelihood, that a single event or small set of events could have occurred by chance. EXAMPLE: H H H H H -- 5 Heads in 5 tosses -- is possible but rather unlikely. Will happen on average with a probability of .5 * .5 * .5 * .5 * .5 = .03.
So, if 100 people toss 5 coins each, 3 out of 100 will get 5 heads or 5 tails in a row. Not so odd -- well within the realm of possibility – in fact it will routinely happen. To be expected. So much of what we think is strange, odd, miraculous is really predictable --the law of randomness at work.
The odds of events occurring -- what outcomes chance alone would produce. How different are the outcomes you obtain from a given sample compared to what results you could get solely due to chance?
The “Expected Value” of a variable is the total value of the scores on that variable times the probability of occurrence. If there is a contest among four people in which one person will win $8 and three people will win $0 the expected value for each person is: Expected Value = $8 x .25 = $2 Note: In this example no one will receive the “expected value.”
This is one major reason why progress in the war on cancer is so slow. If a drug company can charge the same price for a “small improvement” cancer treatment (e.g., extends life 3 months) as a “curative” treatment and the “small improve” treatment is more probable, then the drug company’s incentive (i.e., “expected value”) is greater for doing research trials on the “small improvement” treatment than the “curative” treatment.
In a similar vein, this is why there is so little research on promising “alternative cancer treatments” (e.g., Coley’s Toxins): since the drugs used in the treatment are “common” (i.e., routinely available in stores), the treatment can’t be patented. Thus, the drug company can’t profit to nearly the extent it can with a patented, but potentially less successful, treatment. Health wise, what is in your “best interest” is NOT necessarily in the drug company’s best interest.
Bayes’s Theorem – Another Concept of Probability Bayes’s theorem of probability takes into account the totality of the circumstances surrounding an event. For example, if 1,000,000 lottery tickets are sold, then, using the relative frequency concept of probability, you have a 1/1,000,000 chance of winning.
Bayes’s Theorem - 2 However, if the evening news has a high probability of accurate reporting, and they report that your number has been selected, then, by Bayes’s theorem, the probability of you winning is much, much greater than 1/1,000,000. Since we typically can’t estimate the probability of the circumstances surrounding an event, we won’t use Bayes’s theorem.
The Central Limit Theorem - 1 • If we take repeated samples from a population, the sample means will be (approximately) normally distributed. • The mean of the “sampling distribution” will equal the true population mean. • The “standard error” (the standard deviation of the sample distribution) is analogous to the standard deviation.
The Central Limit Theorem - 2 • A “sampling distribution” of a statistic tells us what values the statistic takes in repeated samples from the same population and how often it takes them.
The Central Limit Theorem - 3 • We use the statistical properties of a distribution of many samples to see how confident we are that a sample statistic is close to the population parameter. We can compute a confidence interval around a sample mean or a proportion: • We can pick how confident we want to be • Usually choose 95%, or two standard errors – Remember, with a normal distribution 95% of the cases are within two standard deviations of the mean.
Central Limit Theorem - 4 Let’s say I do a study of political contributions. For sample #1 I randomly select 1,000 individuals and compute the mean dollar contribution per person. If I repeat this process 399 times (i.e., a total of 400 samples of 1,000 randomly selected individuals each), the distribution of the 400 sample means will be approximately normal.
Central Limit Theorem - 5 Thus, if the mean of the sample means is $25 per person (i.e., I add up all 400 sample means, divide the total by 400 and the average is $25) and the standard deviation of these sample means is $5, approximately 95% of these sample means will be between $15 and $35. This is the central limit theorem. It will be of critical importance!
Two Principles of Tests of Statistical Significance • How great is the relationship between X and Y? 2. How many observations are used in estimating the relationship between X and Y?
The Null Hypothesis The null hypothesis is that the independent variable has no influence on the dependent variable. For example, the party affiliation of the president is unrelated to the policies they pursue.
Errors in Hypothesis Testing Type 1 Error: reject the null hypothesis when the null hypothesis is true. Type 2 Error: retain the null hypothesis when the null hypothesis is false. For us, a Type 1 error is of greater importance than a Type 2 error.
Decision Rule If the results are statistically significant at the .05 level it means the following: (1) we will reject the null hypothesis 100% of the time; (2) 95% of the time we will have made the correct decision because the null hypothesis will be false 95% of the time; (3) 5% of the time we will have committed a type I error because we will have rejected the null hypothesis when the null hypothesis is true; (4) we will never know for certain if the null hypothesis is false.
Probability – Just for Fun What is the logic of the following statement by famous Las Vegas casino owner Bob Stupak: “I only make money when you win!”
Just for Fun! Can you explain the logic of the following statement by former Las Vegas casino owner Bob Stupak: “I only make money when you win!”