Download
1 / 46
460 likes | 555 Vues
Explore the potential discrepancies in aerosol measurements and learn how to ensure data quality. Barry Huebert shares insights on calibration, instrumentation errors, and intercomparisons. Uncover the nuances of flow rates, detection limits, uncertainties, and size definitions.

E N D
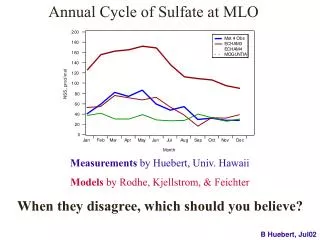
Annual Cycle of Sulfate at MLO Measurements by Huebert, Univ. Hawaii Models by Rodhe, Kjellstrom, & Feichter When they disagree, which should you believe? B Huebert, Jul02
Commercial Slide Film A Commercial Slide Film B One can derive totally different conclusions due to slight differences in calibration B Huebert, Jul02
Aerosol measurements aren’t easy!Don’t believe every number you read … Barry J. Huebert Department of Oceanography University of Hawaii Honolulu, HI 96822 USA huebert@hawaii.edu In what ways are aerosol measurements potentially misleading? What can you do to ensure the quality of other people’s data that you use? B Huebert, Jul02
Nine Questions You Should Ask Observationalists • Do you know the upper-size cut of your inlet and plumbing? • Has this instrument been intercompared with others that use similar or different principles? • How did you calibrate flow rates? • How was your analysis calibrated? • What artifacts or ambiguities are there in this measurement? Any operational definitions? • What is the time-response of this measurement? • What is your detection limit? How are values below this limit tabulated? • What are your uncertainties? How were they determined? • Are there points that need to be flagged for any reason? B Huebert, Jul02
1. Particles have inertia, so some may not pass through inlets and plumbing and will then not be analyzed. B Huebert, Jul02
You don’t have to be moving 100 m/s to lose particles in inlets. This example from a beach-front tower shows losses starting around 2-3 µm in 7 m/s winds. One inlet faced the wind, the other faced upward. M2 Wind M1 B Huebert, Jul02
For >1µm Dust& Seasalt, Inlets Are Critical ACE-Asia Used Low-Turbulence Inlets on the C-130 to Sample Large Particles. (Developed by LeFleur and Seebaugh, DU) B Huebert, Jul02
Fluent Modeling of Enhancement for ACE-Asia LTIs. “They are for high, medium and low pressures: 977 mb, 682 mb, and 380 mb. Enhancements went up at higher altitude because TAS goes up with altitude and maintaining isokinetic flow required more suction. Hence the core flow fraction decreased with altitude.” -Chuck Wilson, Denver University, 31 Oct 2001 This data is now outdated!! B Huebert, Jul02
Particles May Also be Lost in Plumbing. This efficiency has been measured in the lab. How do we deal with the fact that tubing efficiencies will differ for dust and other aerosols? B Huebert, Jul02
We generated pink particles 7 µm in diameter to test ACE-Asia tubing losses in the lab. What processes caused these deposits to be so different? B Huebert, Jul02
Impact of C-130 Plumbing and LTI The magnitude of the error these losses cause depends on the amount of aerosols in each size range and the radiative impact of each size. N The red transmission efficiency includes both LTI and tubing losses. However, since some particles do not stick when they hit a tube wall, the actual efficiency will be somewhere between the red and blue. A V b B Huebert, Jul02
2. Instrument Intercomparisons - “Harmony” ACE-Asia included lots of intercomparisons KingAir: 1 P-3: 2 Kosan C-130 7 3 2 3-5 Twin Otter Ron Brown B Huebert, Jul02
Eight Groups that Measured Elemental and Organic Carbon Participated in an Intercomparison Experiment. Experiments of this type provide realistic uncertainty bounds, even though we don’t know if anyone is right! Precision: WOW!! 4% for OC on particle-loaded filters 12% for OC on backup filters 12% for EC on particle-loaded filters However, there are subtleties of analyzing lightly-loaded samples that introduce uncertainties into airborne EC & OC data. More on this later…. B Huebert, Jul02
This comparison of 3 common cascade impactors by Howell et al. Is striking. Were they in the same air?!? yep... B Huebert, Jul02
Some instruments are less quantitative than others, and “good agreement” needs to be viewed critically. Laser particle counters in ACE-Asia for example: Nine orders of magnitude B Huebert, Jul02
On a linear scale, Area (left) and Volume (below) differ by factors of 2 to 10 or more Beware of log scales on OPC and FSSP data showing “good agreement” B Huebert, Jul02
Surprisingly, some such disagreements are also due to the definition of “size.” Aerodynamic, Geometric, Microscopic size What “size” is this mineral/soot/OC aggregate? ACE-Asia Image by Jim Anderson, ASU B Huebert, Jul02
After PELTI we compared simultaneous SEM and APS size distributions These “visual” sizes did not agree well with the aerodynamic size from the APS. B Huebert, Jul02
3. Flow Measurements & Calibration Nearly every measurement involves collecting or measuring the aerosol in a particular volume of air. Concentrations are derived as: [Aerosol] = Analyte amount / air volume Thus, the aerosol concentration cannot be known more accurately than the integrated flow is known. Instruments that do not record the flow can cause undetectable problems. Flowmeters must be calibrated before and after experiments, at a minimum…. against what kind of standard? B Huebert, Jul02
4. How was your analysis calibrated? Any round-robin comparisons? Ion Chromatography for Cations B Huebert, Jul02
4. How was your analysis calibrated? A variety of problems can make calibration difficult: Swamping, noise, contamination, degeneration, … Ion Chromatography for Cations ? B Huebert, Jul02
5. Are there any artifacts or ambiguities in this measurement? Operational definitions? What is “Organic Carbon” vs “Elemental Carbon?” B Huebert, Jul02
We had many cases during ACE-Asia, however, in which there was very little OC charring, so that did not constrain the split time well. Small sample size may contribute to this problem. B Huebert, Jul02
Other groups that do Evolved Gas Analysis (EGA) define things differently: EGA by Novakov et al. (97) of front and back quartz filters All CO2 below 290C is defined as due to vapor absorption. R&P defines EC as all CO2 evolved above 340C. Operational Definitions B Huebert, Jul02
Serial filters area an attempt to correct for a vapor-adsorption (positive) artifact. Flow Meter Ambient Air ~Particles & Vapor ~Vapor Only - Same Amt as Above? Pump B Huebert, Jul02
Serial filters area an attempt to correct for a vapor-adsorption (positive) artifact. Does this really work? Flow Meter Ambient Air Pump ?? B Huebert, Jul02
Many groups now use Denuders to at least minimize vapor-absorption artifacts. This PC-BOSS sampler by Delbert Eatough was used on the C-130 in ACE-Asia. The denuder strips away adsorbable organic vapors before they can reach the quartz filter. B Huebert, Jul02
C-130 PSAP vs EC before correction This data is now outdated!! B Huebert, Jul02
New PSAP vs EC: Note the Impact of using a correct DL! This data is now outdated!! B Huebert, Jul02
6. Time-Response is critical for some applications. What is the altitude of the lowest layer? The SO2 trace (red) in the ascent profile peaks at a lower altitude than the light scattering (blue & green) measured by TSI nephelometers. Why? Image by Steve Howell B Huebert, Jul02
6. Time-Response The SO2 trace (red) in the ascent profile peaks at a lower altitude than the light scattering (blue & green) measured by TSI nephelometers. Why? The faster time-response of the SO2 instrument. The nephs have to fill a ~5 liter volume at 30 l/min, so they take half a minute to settle to a new value. Image by Steve Howell B Huebert, Jul02
7. What is the Detection Limit (DL) of this measurement? Every instrument will produce some kind of response even when the ambient concentration is below the DL. How can the value of the DL be established? Field Blanks: analyze a “sample” that has not had any real exposure. This blank must be handled and treated exactly the same as every real sample. Often the blank value is subtracted from the sample values. Filter DL = 2-3 x Standard Deviation of the blanks For continuous instruments blanking is often accomplished by filtering the input air, so no particles reach the detector. B Huebert, Jul02
7. How are samples below the Detection Limit tabulated? These are real values, and must be included in averages!! Using only above-blank values would introduce a bias. B Huebert, Jul02
8. Uncertainties? How were they determined? Hopefully by propagation of errors: Flow, Analysis Range, DL, Blank variability Random (precision) vs Systematic (averaging won’t help) Uncertainty is NOT the same as the statistical variation of a set of data! One is instrumental, the other geophysical B Huebert, Jul02
9. Should this data be flagged? This 1 um impactor (used by Tad Anderson and Sarah Masonis in front of a TSI nephelometer to measure sub-micron scattering) collected so much dust on ACE-Asia C-130 RF13 that raised deposits probably changed its cut size from 1 µm. Photo courtesy of Tai Chen B Huebert, Jul02
What Can You Ask of Observationalists? • Do you know the upper-size cut of your inlet and plumbing? If so, how? By direct measurement or by estimate from the literature or a manufacturer? B Huebert, Jul02
What Can You Ask of Observationalists? • Do you know the upper-size cut of your inlet and plumbing? • Has this instrument been intercompared with others that use similar or different principles? B Huebert, Jul02
What Can You Ask of Observationalists? • Do you know the upper-size cut of your inlet and plumbing? • Has this instrument been intercompared with others that use similar or different principles? • How did you calibrate flow rates? B Huebert, Jul02
What Can You Ask of Observationalists? • Do you know the upper-size cut of your inlet and plumbing? • Has this instrument been intercompared with others that use similar or different principles? • How did you calibrate flow rates? • How was your analysis calibrated? Were there any round-robin intercomparisons? B Huebert, Jul02
What Can You Ask of Observationalists? • Do you know the upper-size cut of your inlet and plumbing? • Has this instrument been intercompared with others that use similar or different principles? • How did you calibrate flow rates? • How was your analysis calibrated? • What artifacts or ambiguities are there in this measurement? Any operational definitions? B Huebert, Jul02
What Can You Ask of Observationalists? • Do you know the upper-size cut of your inlet and plumbing? • Has this instrument been intercompared with others that use similar or different principles? • How did you calibrate flow rates? • How was your analysis calibrated? • What artifacts or ambiguities are there in this measurement? Any operational definitions? • What is the time-response of this measurement? B Huebert, Jul02
What Can You Ask of Observationalists? • Do you know the upper-size cut of your inlet and plumbing? • Has this instrument been intercompared with others that use similar or different principles? • How did you calibrate flow rates? • How was your analysis calibrated? • What artifacts or ambiguities are there in this measurement? Any operational definitions? • What is the time-response of this measurement? • What is your detection limit? How are values below this limit tabulated? B Huebert, Jul02
What Can You Ask of Observationalists? • Do you know the upper-size cut of your inlet and plumbing? • Has this instrument been intercompared with others that use similar or different principles? • How did you calibrate flow rates? • How was your analysis calibrated? • What artifacts or ambiguities are there in this measurement? Any operational definitions? • What is the time-response of this measurement? • What is your Detection Limit? How are values below this limit tabulated? • What are your uncertainties? How were they determined? B Huebert, Jul02
What Can You Ask of Observationalists? • Do you know the upper-size cut of your inlet and plumbing? • Has this instrument been intercompared with others that use similar or different principles? • How did you calibrate flow rates? • How was your analysis calibrated? • What artifacts or ambiguities are there in this measurement? Any operational definitions? • What is the time-response of this measurement? • What is your Detection Limit? How are values below this limit tabulated? • What are your uncertainties? How were they determined? • Are there points that need to be flagged for any reason? B Huebert, Jul02
As a last resort: learn how the instrument works! You’re a smart person. You know lots about science. Even though you may not be a chemist or an engineer, you can understand the measurements you use well enough to see where they might be weak. B Huebert, Jul02
Even though observations are subject to a wide range of uncertainties, they are still the best check on the reality of models. But you must use them wisely: Not all observations are equally sound. Work WITH the people who generated the data you use, question them thoroughly, and give the greatest credence to that data with the best quality control. B Huebert, Jul02