Download
1 / 18
180 likes | 430 Vues
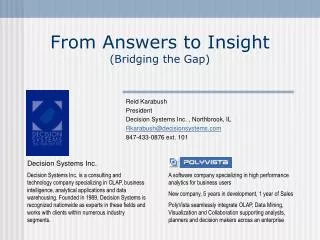
From Answers to Insight (Bridging the Gap). Reid Karabush President Decision Systems Inc. , Northbrook, IL Rkarabush@decisionsystems.com 847-433-0876 ext. 101. Decision Systems Inc.

E N D
From Answers to Insight(Bridging the Gap) Reid Karabush President Decision Systems Inc. , Northbrook, IL Rkarabush@decisionsystems.com 847-433-0876 ext. 101 Decision Systems Inc. Decision Systems Inc. is a consulting and technology company specializing in OLAP, business intelligence, analytical applications and data warehousing. Founded in 1989, Decision Systems is recognized nationwide as experts in these fields and works with clients within numerous industry segments. A software company specializing in high performance analytics for business users New company, 5 years in development, 1 year of Sales PolyVista seamlessly integrate OLAP, Data Mining, Visualization and Collaboration supporting analysts, planners and decision makers across an enterprise
Better Operations & Incremental Improvement $ Growth & Breakthrough Results $$$$ Businesses run on Information (Enquiring Businesses want to Know…) • Reports deliver Answers • Who are your best customers ? • What are your most profitable products ? • Where are sales declining ? • Analysis leads to Insights • What’s Changed and WHY ? • How do I make my best customer better ? • What “Don’t you Know” about the business ? • What important opportunities are you missing ?
Answers Insights High Who? What? Reports (Canned) Reports (ad-hoc) Where? Interactive Query (OLAP) When? Data Mining Low Business Knowledge (how do we get it, what is it worth?) Why? Deeper Understanding In Business… What you Don’t Know can Hurt You ! Usability Did you Know…? New Knowledge Anomalies, patterns, etc Low Low High High Relative Business Value
High Reports (canned) Reports (ad-hoc) Interactive Query (OLAP) Data Mining Low Knowledge Challenges (What are the Problems?) • Requires User to ask the right questions • Many combinations to consider • Where are the nuggets? Usability • Static View of Business • What are the important metrics? • False sense of security • Very Difficult to configure / use • Requires collaboration between business users and statisticians • Results difficult to understand • No validation capabilities Low Low High High Relative Business Value
Answers Insights High Collaborative Analytics Reports (canned) Reports (ad-hoc) Interactive Query + Data Mining Interactive Query (OLAP) Data Mining Low Where to Go from Here ? Discovery Solutions Who, What ? Where, When ? Why ? Did you Know ? Usability Low Low High High Relative Business Value
PolyVista… Bringing Opportunities to Light PolyVista Software uniquely delivers both Answers & Insights to Business users: • PolyVista is designed to answer specific questions (queries) very quickly and easily (intuitive and interactive) • Beyond just answers… PolyVista automates the search for new and valuable Insight from any database (CRM, ERP, Proprietary Systems, etc) PolyVista delivers Value by… enabling the broader base of non-technical users to not only apply their knowledge and experience to known problems but more importantly to discover and develop new (previously unknown) business opportunities
Key Benefits of PolyVista • Put usable analytics in the hands of Business users, a synthesis of Power and Simplicity. • Interactive Analysis enables a broader base of a company’s knowledge workers. Leveraging their skills and experience to solve problems or develop a deeper understanding of business issues and opportunities • Discovery Algorithms automate the process of discovering new opportunities or identifying previously unknown issues (Deliver New Knowledge / Insight / Understanding) • PolyVista (many views) was designed to allows users multiple ways to analyze data. Seamlessly integrating OLAP, Data Mining and Visualization techiques into a single application • Enable Knowledge Sharing and collaborative analytics
PolyVista… Discovery Driven Solutions • Compaq (Houston TX) - Developed Customer Satisfaction and Warranty Parts management System (integrated view of Cust Sat, Call Center and Parts Mgt, proactive vs reactive approach, 10 + million $ savings to date) • Verizon West (Dallas TX) – Customer Call Center Analytics, performs analysis of customer call representatives activities including problem resolution and cross-selling objectives • Service Corp International (Houston TX) – Customer profiling and segmentation analysis to identify and manage new Sales and Marketing initiatives • First Choice Medical Mgt (Houston TX) – providing medical billing reporting and analysis to both physicians and their staff analysts (claim processing metrics, data integrity and staff performance)
Delivering the Value ! PolyVista … • Front-ends Microsoft’s Analysis Services (OLAP) Leverages the speed, flexibility and ease of use of this market leading multi-dimensional data base • Supports Interactive Knowledge Discovery Iterative process of discovery (learning) enabled by integrating data mining and interactive query • Includes multiple Discovery Algorithms Easy to use, automated and fast, these algorithms deliver guided analysis directly to end-users • Incorporates Collaborative Analytics Extend the scope and value of analytics via collaboration and knowledge sharing techniques
PolyVista Wisdom Analytical & Collaboration Engine Microsoft Analysis Services Cubes Existing Data Warehouse 3rd Party Data Sources PolyVista & Microsoft Analysis Services Powered by Microsoft OLAP, PolyVista delivers unmatched performance and ease of use PolyVista Clients Existing Operational Databases
Interactive Knowledge Discovery Leverage the users knowledge and experience Iterative process of learning enabled by integrating mining and interactive analysis Mined results (nuggets) can be immediately reviewed and validated These nuggets can represent actionable insight in and of themselves. These nuggets can be the seed for additional, more targeted mining or Interactive analysis (OLAP)
PolyVista Discovery Algorithms Automate the process of discovery - New Opportunities, Knowledge, Insight and Understanding • Deviation Detection (find anomalies or inconsistencies) • Multi-Dimensional Searches (top 10, bottom 10, etc) • Rule Detection and Classification (IF X and Y then Z) • Affinity Analysis (when X occurs, Y occurs) • Cluster analysis (finding/grouping along similar attributes)
PolyVista Wisdom (Collaborative Knowledge Discovery) Enable Knowledge Sharing and collaborative analytics Background or server based mining Algorithm configuration can be centrally managed Results (nuggets) are sent to a nugget repository (SQL DB) Nuggets can be “attributed” by reviewers Business users can simply search the repository for validated, qualified nuggets Nuggets can be the seed for additional, more targeted mining or Interactive analysis (OLAP)
32 bit Client Screenshots
Analytical Processing • On-line Analytical Processing (OLAP) • End-user driven query and analysis • Intuitive and user friendly GUI • Windows architecture • Drag and drop functionality • “Slice and dice” – Drill down • Reporting, Charting and Graphing • Summarization, Sorting and Filtering • Easy sync to data source
Visualization • Fully interactive 2-D and 3-D visual models (many patented) • Synchronized with OLAP Controls and data table • Full motion controls for graphics • Visualizations animated using simple player control and “click and drag” • Customizable color pallet and “look and feel” • “Watermark” analysis for quick segmenting • Creates easily understandable graphics
Discovery / Data Mining • Algorithms automate process of knowledge discovery • 6 algorithms currently • Results ranked in order of strength of positive and negative correlations • Find anomalies, correlations, trends effortlessly across volumes of data • Speed allows for both pure discovery and guided analysis • Seamless integration with analytics and visualization
Any Questions ? Comments ! For information: www.decisionsystems.com