Download
1 / 34
340 likes | 477 Vues
Western Air Quality - Critical Infrastructure. Spring 2005 WESTAR Business Meeting May 5, 2005. Emissions Factors – What are the problems?. Inventory developers and modelers have told us: EFs gaps for new source types and pollutants (e.g., HAPs) EF development process too slow and wasteful

E N D
Western Air Quality - Critical Infrastructure Spring 2005 WESTAR Business Meeting May 5, 2005
Emissions Factors – What are the problems? • Inventory developers and modelers have told us: • EFs gaps for new source types and pollutants (e.g., HAPs) • EF development process too slow and wasteful • Need data quality values for accuracy assessments • Regulatory authorities and sources have told us: • Annual EFs inequitable and inaccurate for threshold determinations (e.g., NSR, PSD, SIP control strategies) • Need tools and guidance for daily/hourly compliance and enforcement applications (i.e., current AP-42 and other guidance inadequate for title V, MACT)
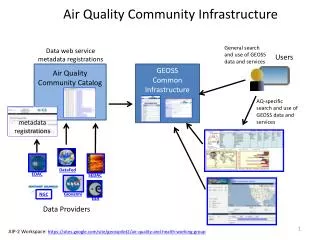
120 120 120 120 120 120 120 120 120 120 120 Program Program Program Program Program Program Program Program Program Program Program 100 100 100 100 100 100 100 100 100 100 100 Title V permits Federal Federal Federal Federal Federal Federal Federal Federal Federal Federal Federal Industrial Industrial Industrial Industrial Industrial Industrial Industrial Industrial Industrial Industrial Industrial 80 80 80 80 80 80 80 80 80 80 80 Residual Risk Residual Risk PSD NSR 60 60 60 60 60 60 60 60 60 60 60 Emissions Factor Demands Emissions Factor Demands Emissions Factor Demands Emissions Factor Demands Emissions Factor Demands Emissions Factor Demands Emissions Factor Demands Emissions Factor Demands Emissions Factor Demands Emissions Factor Demands Emissions Factor Demands Title V Permits Title V Permits $ Millions Expended (Constant 2004) $ Millions Expended (Constant 2004) $ Millions Expended (Constant 2004) $ Millions Expended (Constant 2004) $ Millions Expended (Constant 2004) $ Millions Expended (Constant 2004) $ Millions Expended (Constant 2004) $ Millions Expended (Constant 2004) $ Millions Expended (Constant 2004) $ Millions Expended (Constant 2004) $ Millions Expended (Constant 2004) Residual Risk Residual Risk MACT NSPS 40 40 40 40 40 40 40 40 40 40 40 PSD/NSR PSD/NSR Title V Permits Title V Permits Regional Modeling Regional Modeling Regional Modeling Risk (NESHAP) Risk (NESHAP) PSD/NSR PSD/NSR PSD/NSR PSD/NSR 20 20 20 20 20 20 20 20 20 20 20 PSD/NSR PSD/NSR Regional Modeling Regional Modeling Regional Modeling Regional Modeling Regional Modeling Regional Modeling Regional Modeling Regional Modeling Regional Inventories Regional Inventories Regional Inventories Regional Inventories Regional Inventories 0 0 0 0 0 0 0 0 0 0 0 Regional Inventories Regional Inventories Regional Inventories Regional Inventories Regional Inventories Regional Inventories 70-75 70-75 70-75 70-75 70-75 70-75 70-75 70-75 70-75 70-75 70-75 75-80 75-80 75-80 75-80 75-80 75-80 75-80 75-80 75-80 75-80 75-80 80-85 80-85 80-85 80-85 80-85 80-85 80-85 80-85 80-85 80-85 80-85 85-90 85-90 85-90 85-90 85-90 85-90 85-90 85-90 85-90 85-90 85-90 90-95 90-95 90-95 90-95 90-95 90-95 90-95 90-95 90-95 90-95 90-95 95-00 95-00 95-00 95-00 95-00 95-00 95-00 95-00 95-00 95-00 95-00 00-05 00-05 00-05 00-05 00-05 00-05 00-05 00-05 00-05 00-05 00-05 Year Year Year Year Year Year Year Year Year Year Year What is the State of the EF Development Program? Hourly Annual
What do we plan for revamping EF development program? • New EF development program based on partnerships • Producing data of known quality • Using standardized procedures • Ready access to data
What do we plan for revamping EF development program? • EPA leveraged partnership role • Provide oversight and guidance for data collection, analysis, and management • Catalyst for new EF development projects • Emission Factor Program Contact: • Fred Thompson, 919-541-2707 (thompson.fred@epa.gov)
Producing data of known quality Draft Source Test Assessment Options Paper Draft Adjustments for Non-Inventory Applications Options Paper Standardized procedures Draft Electronic Automated Reporting Options Paper Ready access to information and data Monitoring Knowledge Base Website EFPAC Information Website Partnership products Printers Technical Support Document New chapters in AP-42 (petroleum refineries, DoE, steel) New Emission Factor Products
Producing data of known quality Draft Source Test Assessment Procedures Pilot Assessment of Adjustments for Non-Inventory Applications Producing EFs of known quality Standardizing procedures Draft EF Development Procedure Draft Electronic Data Automation Tools Ready access to information & data Cold Fusion replacement for FIRE/AP-42 May 2005 August 2005 Ongoing May 2005 June 2005 September 2005 Target Dates for Additional Emission Factor Products
The Air Toxics Ambient Monitoring Programs • NATTS (Section 103) • 23 trend sites • Measure long term program progress NATTS • Local-Scale Monitoring Projects (Section 103) • Competitively awarded • Limited duration • Specific local-scale issues Local-Scale Monitoring Projects Other Local Programs • Other Local programs (Section 105) • S/L agency discretion
Air Toxics Monitoring • $6.5 million in 105 STAG, nominally • $10 million in 103 STAG • Not enough for a geographically complete monitoring network like in NAAQS programs. • Actual uses have been decided by OAQPS-chaired steering committee. • 22 Trends sites. • 16 limited-duration local projects. • OAQPS-managed projects on methods, QA, and data analysis. • STAPPA/ALAPCO was critical in FY2004 and FY2005, but for FY2006 has made specific suggestions up front. • Awaiting STAPPA/ALAPCO reaction to EMAD’s proposal on exactly how to incorporate those suggestions. • Coordinating on specifics of current round of data analysis. • New staff lead in EMAD – Mike Jones • Coordination within OAQPS is good • Regions have issues, which are being discussed at staff and APM levels
National Air Toxics Trend Station Network (NATTS) • 103 Grant funds (no matching required / greater accountability) • 23 national air toxics trends sites; 17 urban / 6 rural • Colocated with PM2.5 speciation samplers • Focused on six priority pollutants (formaldehyde, arsenic, chromium, benzene, 1,3 butadiene, acrolein) + light absorbing carbon • Provide core accountability measurements over time • All sites follow QA program for sampling / sighting • Periodic refinement of pollutants / sampling • Evaluate every 6 years
Local-Scale Monitoring Projects • 103 Grant Funds • Middle and Neighborhood scale (.5km to 4 km) air quality impacts from toxics that are not adequately detected at NATTS • 10 to 20 projects are expected to be funded each year in different locations • Selected through open competition process • FY2004 – $6.2 Million • 16 sites recommended for award from 49 proposals • Open competition following set criteria, also project types and regional considerations in selection process • All projects underway as of Jan 2005 • FY2005 ~ $6.0 Million • Solicitation anticipated late April 05
Other Local Programs • Currently $6.5 Million • Local / highly flexible monitoring that enables State / local agencies to address specific concerns • Hot spots • EJ • Public complaints • Flexibility accompanied by matching funding requirements • Funds disbursed to States by EPA Regions
National Monitoring Strategy - Current Events • Current Air Monitoring Network • National Ambient Air Strategy • Involving AQ planners & S/L Air Directors • NPRM on Air Monitoring Rule • NCore level 2 program • CASTNet role and vision • IMPROVE & PM2.5 Speciation Networks • Tribal Air Monitoring
National Ambient Air Monitoring Strategy (NAAMS) • Key Reasons for Change • Monitoring programs have not had a thorough rationalization in 30 years. • Time to • Recognize there is one multi-pollutant atmosphere. • Re-balance priorities among purposes for ambient monitoring. • Take advantage of newer technologies for resolution, efficiency, and timeliness of data. • Eliminate redundant and low-value monitoring. • Process for Development • Timeframe: Started in 2000. Drafts issued Sept. 2002 and April 2004. • National Monitoring Strategy Steering Committee. • Three topical working groups of monitoring specialists in EPA and state/local agencies. • CASAC reviews. • OD and AA briefings. • Current Status – “Final Draft” • Implementation • State buy-in. • Rule changes. • Funding shifts. • Technical guidance and outreach.
Involving AQ Planners and S/L Air Directors • Strategic vision in the NAAMS most reflects the input from atmospheric sciences and health effects communities. • The practical quality management perspective was more lightly represented. • Now that we are on the verge of specific shifts, we will be involving state/local SIP planners and S/L Air Directors more. • Actions on specific sites. • Pace-of-change issues. • Regional offices always make final decisions within rule provisions and resource constraints.
Air Monitoring NPRM • History of development • Flows logically from the NAAMS. • EPA/State/Local workgroup active in 2001-2004, reviewed and provided input to regulations in detail. • Separate workgroups on QA aspects and continuous PM2.5 equivalency. • Provisions • NCore level 2 requirements. • Revised minimum network requirements for O3 and PM2.5 sites. • Equivalency criteria for approval of PM2.5 continuous monitors. • Changes in QA requirements. • Requirement for 5-year cycle of network assessment. • Timing – Needs to be final to allow funding shifts to fully take place • Next Steps • Group leader review/polish. • Educate newly assigned OGC staff. • Share key content with state/locals to foster good relations and avoid misinformation. • Start formal process to submit to OMB.
National Monitoring StrategyLeading Through Rules and Funding Blue - 103 Funded Yellow – 105 Funded Green – Mixed 103, 105 and/or OAQPS Funding Purple – Not Funded Gold – Funded by OAP
NCore Level 2 Program • Purpose and approach • Backbone of the new multi-pollutant monitoring network. • Multiple objectives, but need to stay within constrained resources. • Presumes and facilitates a larger role for air quality modeling in air quality management. • Capability • All pollutants relevant to ozone and PM. • Real time or at least hourly. • Accurate at low scale “trace” concentrations. • 55 urban sites, 22 rural. About XX tentatively identified so far. • Incremental additions to current sites (usually) • Status • No sites actually operating with all planned capabilities. • Technology try outs in progress at 5 to 10 sites per technology, as technologies are ready. • We are assembling a model site on the RTP campus for technology prove out, guidance development, and training site. • Identifying other sites, with states and Regional Offices. • Identifying reductions in other monitoring in 2006-2008 timeframe to allow funding of staged deployment.
Working with EPA Regions, State, and local agencies on first pass at NCore Level II site recommendations:
CASTNet Role and Vision • Background • Aimed at showing effects of regional cap-and-trade programs on ozone and acid deposition, and the need for more reductions. • About 80 sites, contractor operated, CAMD-funded at about $4 million per year. • Historically, not much linked to OAQPS and state/local monitoring programs, procedures, and data systems. OAQPS use mostly limited to air quality model validation. • Vision • Bring CASTNet and state/local programs into one collaborative strategic process and plan. • Use CASTNet to introduce and train state/local staff on best technologies. • Use EPA-funded CASTNet technicians to support broader range of monitoring operations at key sites. • Reduce state monitoring requirements where CASTNet provides equivalent data. • Increases the effective size of the overall monitoring pie.
IMPROVE • Purposes • Understand contributors to haze • Track long-term progress on visibility • Class I areas, mostly. Western emphasis. • National Park Service role • Funding Issue • Much of the funding comes from the 103 PM monitoring budget and the 105 budget. • Rationale was the States’ responsibility to develop Haze SIPs and track progress. • Because interstate transport is involved, not just a state-by-state decision. • State Air Directors now may not all be happy with local implications of those decisions. • May prefer less on IMPROVE and more on urban problems.
PM2.5 Speciation Network (STN) • Purposes • Crucial to telling what causes urban PM2.5 nonattainment. • Crucial to air quality modeling. • Useful for accountability. • States/locals also view it as monitoring for diesel PM as a HAP. • 54 “Trends” sites – EPA in the lead • 162 “Supplemental” sites – States in the lead • Original intention was to cut back Supplemental sites starting about now. • Phone calls with Regions have tentatively identified lower-value sites. • Staged reduction plan: Cut about 25% SLAMS sites in FY2006 budget, about 25% more in FY2007 budget. Keep virtually all NAMS sites. • Makes resources available for NCore 2. • State reactions: • Mixed reactions at monitoring expert/manager level. • Some Air Directors want to go more slowly. • EPA has not yet factored in diesel PM air toxics aspect of these sites. • Regions have final say on site-specific changes. • Method issue • STN and IMPROVE use 2 different methods for separating carbon fractions. Other issues also. • CASAC favors consistency, leans towards STN become more like IMPROVE to get there. • EMAD tentatively planning on moving to IMPROVE methods, still studying how thoroughly and how quickly.
Tribal Air Monitoring • Up to now, little guidance from OAQPS that is specific to tribal monitoring. • Regions handle project selection and funding. • ORIA’s Tribal Air Monitoring Support (TAMS) center provides training on equipment and procedures. • ITEP provides training. • Some Regions provide help in handling the data. • Outputs and outcomes of tribal monitoring to date are mixed and/or uncertain. • Now starting up an OAQPS & Regional project to define and develop more useful guidance document/chapter over the next year. Beth Craig request. • New IPA in EMAD – Annabelle Allison from ITEP – will be helping.
Ambient Air Monitoring Contacts • National Monitoring Strategy - Tim Hanley, 919-541-4417, hanley.tim@epa.gov, including: • NCore level 2 program • Planning Coordination • NPRM on Air Monitoring Rule • IMPROVE Network, Marc Pitchford, 702-862-5432, marc.pitchford@dri.edu • PM2.5 Speciation Network, Joann Rice, 919-541-3372, rice.joann@epa.gov • CASTNet, Gary Lear, 202-343-9159, lear.gary@epa.gov • Tribal Air Monitoring, David Lutz, 919-541-5476, lutz.david@epa.gov • Ambient Monitoring QA, Mike Papp, 919-541-2408, papp.michael@epa.gov
Smoke Monitoring Objectives • Goal: Develop consistent, fine particulate air monitoring guidance and protocols to be used by EPA, State/Local agencies, and FLMS during wildfire emergency air monitoring episodes. • Purpose: Provide appropriate monitoring data to better protect public health from the effects of wildfire smoke.
Smoke Monitoring Strategy • Develop an interagency discussion group of stakeholders to share current approaches and build consensus on essential minimum needs and requirements for instrumentation, quality assurance, reporting, logistics, and staffing. • Establish a working group of State agency collaborators to work with EPA and FLMs and begin operation of portable smoke monitors for intercomparison with PM2.5 FRMs at national air monitoring sites. • Formulate a basic set of operational protocols for deploying the monitors during wildfire events and incorporate USFS remote data transmission technology experience through trial deployment during actual episodes • Address additional issues such as monitoring for other emissions constituents, public access to real time monitoring data (AIRNOW), interaction between States/EPA/FLMs during emergency actions. • Consolidate experience feedback from trial deployments and recommend draft final protocols for nationwide application.
Smoke Monitoring Investment • Partners: • States: New Mexico, Arizona, California, Oregon, Washington, Alaska, Montana, Colorado, Nevada, and Idaho • EPA: Regions 6,8,9,10, and OAQPS • Resources • FY-04 OAQPS - purchase of one smoke monitor for each State participant and contractor support. Fish and Wildlife-purchase two smoke monitors plus provide technical assistance for operational and logistics training from Forest Service Missoula Fire Research Laboratory. States provide study participants to collaborate and operate monitors • FY-05 OAQPS - purchase of remote data satellite transponders and contractor support for State collaborators. Forest Service-technical assistance on developing field deployment logistics and data reporting. States provide staff to test trial field deployments. • FY-06 OAQPS-provide contractor support to draft final recommended SOPs, QA guidance, data reporting, and field deployment logistics guidelines. Conduct 3 training seminars for State agencies, as appropriate. • Contact: James Homolya, 919-541-4039, homolya.james@epa.gov
This is the end – so … • Here’s the thoughts I’d like to leave you with … • Thanks for the opportunity to join your meeting.