
Uploaded by
ardice
1 SLIDES
132 VUES
10LIKES
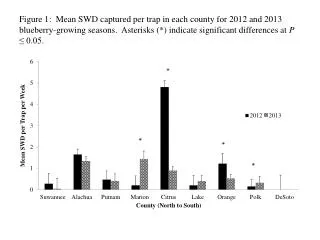
Mean SWD Captured Per Trap in Counties During 2012 and 2013 Blueberry Growing Seasons
DESCRIPTION
This figure illustrates the average Spotted Wing Drosophila (SWD) captured per trap in various counties throughout the blueberry growing seasons of 2012 and 2013. Significant differences in SWD captures are denoted by asterisks (*) as per the statistical significance level of P ≤ 0.05. This data highlights the variations in SWD populations across different regions, contributing to our understanding of pest management in blueberry production.
Download
1 / 1
Télécharger la présentation 
Mean SWD Captured Per Trap in Counties During 2012 and 2013 Blueberry Growing Seasons
An Image/Link below is provided (as is) to download presentation
Download Policy: Content on the Website is provided to you AS IS for your information and personal use and may not be sold / licensed / shared on other websites without getting consent from its author.
Content is provided to you AS IS for your information and personal use only.
Download presentation by click this link.
While downloading, if for some reason you are not able to download a presentation, the publisher may have deleted the file from their server.
During download, if you can't get a presentation, the file might be deleted by the publisher.
E N D
Presentation Transcript
Figure 1: Mean SWD captured per trap in each county for 2012 and 2013 blueberry-growing seasons. Asterisks (*) indicate significant differences at P ≤ 0.05.
More Related
Audio
Live Player