Slide Note
0 likes | 15 Vues
Post-1994, South Africa implemented transformation policies to empower black entrepreneurs and industrialists. The Black Industrialists Policy aimed to increase black ownership in key sectors. Despite progress, barriers such as limited access to funding and markets persist, hindering the growth of black businesses. The evolution of BEE from 1994 to 2022 saw improvements in evaluation and penalties for non-compliance, yet challenges remain in achieving meaningful inclusion and addressing economic inequalities.

E N D
High-level Economic Impact Report of Black Economic Empowerment and the Black Industrialist programme June 1st2023 Final Report 1
The Policy Context The initial transformation policies post 1994 focused largely on enabling black South Africans to obtain a non-controlling stake or equity in existing enterprises. It did not address the need to focus on new enterprise development nor to promote businesses controlled by black South Africans. • This is a necessary requirement for social stability and given South Africa’s unusually high levels of concentration in many sectors of the economy, is also essential to injecting dynamism and competition in the economy. The transformation imperative is thus underpinned by both social and economic needs. • In 2015, Cabinet approved the Black Industrialists Policy, which seeks to increase participation of black South Africans in ownership and control of productive enterprises in key sectors and value chains of the economy. • 2
Transformation Economic transformation is wider than B-BBEE policies and embraces a number of elements, including: • Transforming the structure of the economy to grow faster and more inclusively e.g addressing high levels of market concentration (including through competition policies). • Shifting the dependence on export of raw materials and building a more balanced, dynamic economy (industrial policies). • Promoting the participation of black South Africans, women and young people in the economy, to broaden the base of entrepreneurship and promote fairness (including B-BBEE policies). 3
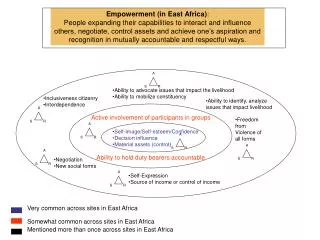
Objectives of empowerment Objectives of empowerment Empowerment has evolved into a policy that has multiple objectives within an over-arching policy thrust: • First, it is about redress to deal with the history of exclusion and the legacy it has left • Second, it lays the foundation for deeper growth through greater economic inclusion that widens the talent pool of enterprise drawn from black South Africans, women and young people; and • Third, it is increasingly about addressing the high inequalities in our society, a challenge many more countries now face, associated with globalisation’s impact in different parts of the world. 4
HIGH LEVEL EVOLUTION OF BEE 1994-2010 Characterised by: • Businesses self-determining re BEE; • Focus on ownership and equity transactions; • State lever of public procurement; • Codification of BEE around specific expectations and targets; • A sense of compliance emerged; • Beginning to see BEE as a cost; • Limited coherence across government departments
EVOLUTION OF BEE AND B-BBEE FROM 2010 TO 2022 Characterised by: i. Amendments to the BEE Act (2013) ii. Improvements evaluation; iii. The introduction of penalties; iv. The creation of incentive schemes to support black owned and managed enterprise; v. Improved monitoring and evaluation- in response to poor compliance on the part of firms since the original Act was promulgated- all measurement categories became compulsory from 2016; vi. Reporting obligations were strengthened, including for firms listed on the JSE; vii.Presidential B-BBEEAdvisory Council; viii.Charters, codes, and scorecards i. Equity equivalent investment programmes ii. Revised EEAct of 2020 to compliance, monitoring, and
Challenges that Continue to Hold Challenges that Continue to Hold- -back Black Entrepreneurs/Enterprises back Black Entrepreneurs/Enterprises Significant and recalcitrant barriers to entry for black people in terms of inclusion in the economy remain; The lack of broad-based inclusion, and the lack of a meaningful black industrialist grouping are still important issues to be addressed; Black businesses face higher barriers to entry arising from their continued exclusion from established business networks and value chains, and because of the struggle to find collateral when applying for business loans due to a lack of assets arising from old, skewed ownership patterns; Lack of access to inputs and markets; Lower levels of skill; Inadequate access to funding from DFIs as well as the commercial banking sector; A failure of industrial policy to fully coordinate industrial, competition and empowerment policies resulting in gaps in addressing barriers; and Insufficient policy attention to the difficulties in accessing value chains for black businesses, especially downstream • • • • • • • • Sources: Literature & interviews, 2022-2023 7
Sources Sources As is well-known, quantitative research on BEE trends is a relatively under-developed area. Recently, the private-sector has begun to publish regular analyses of progress on BEE such as the Sanlam Transformation Gauge. • In addition, the dtic contracted Blueprint Consulting to undertake an independent evaluation of BEE and BI programmes. • • The following section draws extensively from the initial findings of this research and should be attributed solely to Blueprint Consulting. 8
Economic Impact of B-BBEE Funding High level economic impact of High level economic impact of B B- -BBEE FY 2009/10 to 2021/22 FY 2009/10 to 2021/22 – – 13 Years (audited) BBEE funding: funding: 13 Years (audited) High-Level Analysis of All B-BBEE Funding – 13 Years: • B-BBEE GDP Entity Impact from 2009 to 2021: • Funding approved • Funding approved • IDC GDP Impact • NEF GDP Impact • The dtic GDP Impact • Total GDP impact • 2021 GDP Impact R 99.85 bn Current R 137.98 bn Constant 2021 R 275.96 bn [78.8 %] (Constant 2021) R 49.13 bn [14.0 %] (Constant 2021) R 25.07 bn [ 7.2 %] (Constant 2021) R 350.15 bn 0.28 % [R 17.59 bn v SA R 6,192 bn] • B-BBEE Jobs Entity Impact from 2009 to 2021 - 13 Years: • Funding approved • Funding approved R 137.98 bn Constant 2021 • IDC Jobs Impact • NEF Jobs Impact • The dtic Jobs Impact • Total Job impact Employment • Full 13 Years • 2021 Job Impact R 99.85 bn Current 635,846 Jobs [67.0 %] 195,260 Jobs [20.6 %] 118,574 Jobs [12.5 %] Source: Industrial Development Corporation (IDC), 11 January 2023. Estimation of the economy-wide impacts of the funding provided by the dtic group of entities for Broad- Based Black Economic Empowerment purposes and specifically for the development of Black Industrialists. Blueprint interpretation. 949,680 Jobs / 7.93 % [SA 11,978,493 Formal Employ.] 0.70 % [83,393 vs SA 11,978,493 10
Charter and Codes Background • Ten sectors have developed sector specific codes that have been gazetted in terms of Section 12 of the B-BBEE Act; • Developed and agreed upon by major stakeholders in the industry; used as a statement of intent by industry players; and are binding between and among businesses operating in the industry; • Once a measured entity falls within the scope of a particular sector code, it must be measured or verified on the basis of that code, and no longer on the basis of the generic Codes of Good Practice; • Measurement of achievements against code and charter targets is undertaken by the B-BBEE Commission which is charged with reporting annually on the performance against code targets by sector but reporting compliance has been low and not representative; • Some sectors provide public reports annually as well and there are some private sector firms reporting on the data (Sanlam Gauge, Banking sector and others). 11
Trends in performance Item 2017 2018 2019 2020 2021 Ownership Overall black ownership 27% 25% 29% 31% 39.5% Overall black women ownership 9% 10% 12% 15% 12.4% JSE listed entities average black ownership 100% black owned entities on the JSE 29% 25% 31% 28% 39% 1% 1% 3% 0% 0% Adapted from B-BBEE Commission (2021) The B-BBEE Commission figures differ quite substantially from those of the Gauge report and the sector charter reports (where these are available). 12
ANNUALISED BLACK OWNERSHIP (BO) AND BLACK WOMEN OWNERSHIP (BWO) % OF TARGET. PER SECTOR, JSE 2017 2018 2019 2020 2021 Sector BO BWO BO BWO BO BWO BO BWO BO BWO Agri Bee 12 4 14 6 25 11 20 10 17 10 ) Construction 32 3 - - 42 16 48 14 49 17 Finance 19 7 19 8 15 9 15 7 24 10 Forestry Generic 43 13 14 5 39 25 11 11 34 30 13 13 - 27 - 12 - 34 - 13 ICT 23 9 25 7 32 13 20 9 37 17 MAC Property Tourism 27 81 15 12 36 5 - 14 41 - 8 19 - 15 31 - 4 14 - 13 31 - 6 15 - 23 52 - 9 29 Transport 32 14 26 11 59 28 48 18 78 38 Adapted from B-BBEE Commission (2021) 13
Large Entities % of target ownership by sector Black people – all Sector Agri Bee Construction Finance Forestry Generic ICT MAC Property Tourism Transport Black Women Sector targets 10% 30% 10% 10% 10% 10% 30% 10% 15% Sector targets 25% 32,5% 25% 25% 25% 30% 45% 27% 30% 25% % Target achieved 20% 50% 46% 46% 32% 39% 40% 20% 57% 26% % Target achieved 8% 17% 22% 22% 14% 19% 25% 11% 30% Adapted from B-BBEE Commission (2022) Large Enterprises, are entities with an annual turnover of above ZAR50 million 10% 11% 14
B-BBEE % OF TARGET ACHIEVED, LARGE FIRMS BY SECTOR (2021) Management Control Sector ESD Skills Development Socio economic Agri Bee Construction Finance Forestry Generic ICT MAC Property Tourism Transport 65.7% 67.4% 61.4% 50,7% 57,7% 53,9% 45,4% 35.5% 60.1% 61% 70.6% 67.6% 76.1% 61.8% 62.2% 61.1% 66.2% 58.7% 68.3% 72.6% 75.7% 72% 74.5% 80.5% 86.2% 66.6% 80.8% 66.4% 86.7% 225.8% 153.1% 123.7% 142.5% 87.4% 177.3% 224.7% 179.2% 203.9% Adapted from B-BBEE Commission (2022) 66.1% 55.3% Adapted from B-BBEE Commission (2022) 15
NON-OWNERSHIP ELEMENTS OF BEE AS A % OF TARGETS MET Item Management control 2017 2018 2019 2020 2021 JSE Organs of State &SOEs JSE Organs of State & SOEs JSE Organs of State & SOEs JSE Organs of State & SOEs 38% N/A 38% 79% 44% 68% 28% 65.8% 53.6% 83% Skills development 35% N/A 63% 64% 59% 31% 64% 42% 69.6% 45% Enterprise and supplier development Socio-economic development 47% N/A 70% 47% 59% 59% 67% 68% 73.5% 60% 79% N/A 92% 65% 89% 53% 93% 33% 91% 84% Adapted from B-BBEE Commission (2022) 16
B-BBEE % OF TARGET ACHIEVED, JSE FIRMS BY SECTOR (2021) Management control Sector ESD Skills development Socio economic Agri BEE Construction Finance Forestry Generic ICT MAC Property Tourism Transport 35% 70% 39% 65% 84% 56% 40% 89% 60% 81% 113% 91% - - - - 52% 59% 50% 98% 48% 99% 47% 94% - - - - 41% 68% 65% 62% 103% 70% 36% 89% 88% 59% 160% 84% Adapted from B-BBEE Commission (2022) 17
Assessment of the extent of Business support for BEE 18
Consultations 5 large, listed firms JSE top 40; • Of which, 3 are in Financial Services, 1 is in retail, and one is in Information and Communications Technology (ICT), and media. 1 large unlisted firm; 2 BEE related state programmes/agencies; 1 non-profit social enterprise focussed on youth unemployment; 1 collaboration between the Presidency and the Private Sector; 1 corporatist structure consisting of organised business, government, labour, and development communities; 2 Development Finance Institutions (DFIs); 7 Business federations; • Note that most of the organisational respondents represent significant groups of firms, for example, BUSA alone represents 35, BUSA consists of approximately 35 organisational members representing: Unisectorals. Corporate representative organisations. Chambers of commerce & industry, which in turn represent more members. BLSA has as members the largest firms in SA, listed and unlisted, inter alia. SACCI reports over 22,000 individual company members. 3 Sector charter councils; 2 research organisations; 1 State Owned Enterprise (SOE); 1 Stock Exchange Company; 1 global investment firm with South African presence. (28) 19
Summary of findings Support for B-BBEE as a national policy was almost universal amongst the 28 respondents, with criticism reserved (regardless of size) far less for B-BBEE as a policy, and far more for its complexity, and how it is implemented; When the literature and interview responses were analysed, some perceptions were related to the size of entities which affected views on B-BBEE and support for the policy- largely with smaller firms, the administrative burden of compliance was viewed as costly and onerous; The policy is viewed as an essential component for growth, inclusion, and stability and by most, as a moral and ethical imperative; The impetus for transformation to be found in a growth economy should not be underestimated; There are challenges in administration, complexity and implementation outside private sector, and to some extent, State control. The main challenges for SMMEs are linked to access to support for black owned enterprises, and especially for black women owned enterprises; For mid-sized firms, access to financial support can also be problematic. Access to listing can be expensive, raising funding may be difficult and smaller and medium cap securities tend to be undervalued and discounted; there is support for B-BBEE within mid-sized firms, but this group is more concerned with survival and growth; 20
Summary of findings For companies listed on the JSE, including multi-nationals, holdings companies and those who have a dual listing, B-BBEE is viewed by many respondents as an essential compliance issue, but also by as a social and inclusion imperative; The actual implementation of B-BBEE strategies within the firms tends to be at the operational level in companies held (such as in South Africa, South African Breweries [SAB] implements for its international holding company AB- Inbev) rather than at the holdings level; • Ownership is still a contentious issue. For large, listed internationals and holding companies, it is preferable to pay into the EEIP or implement an ESOP or broad-based shareholding scheme for black people at a local subsidiary level. For family-owned businesses, in some cases the ownership criterion is difficult, and they prefer to focus on other elements. Most small and micro enterprises are already majority black owned and controlled and the issues are more related to support (financial and non-financial) to promote survival and growth, than ownership and control; • While early BEE deals created a class of asset rich black South Africans, the current realities suggest that share ownership as a means of building wealth for black South Africans outside of workers schemes and similar, is not a strategy used by cash poor South Africans. The JSE reports that over 90 percent of all shareholders cashing in on shareholder schemes as they come due, do not reinvest in the market; 21
Thematic Analysis • The 28 respondents all demonstrated awareness and understanding of B-BBEE and its objectives and indicated support for the policy as i) a socio-economic imperative ii) a moral and ethical necessity in terms of social justice iii) a legal requirement and iv) a necessary compliance in order to do business with the State; • Respondents view the B-BBEE policy as having successfully begun a move toward a more inclusive business community, especially through the ESD and skills development elements. • Previously disadvantaged communities are being assisted through the socio- economic measures being taken and inequality is beginning to be addressed; • B-BBEE was criticised for not being broad based enough; not doing enough for the youth and women, and the perception has persisted that an élite is benefiting at the expense of the ordinary black person. • Other criticisms have been the focus on ownership as a priority element of the codes, and that the policy is too complex and bureaucratic making it difficult to comply and understand; Unnecessary barriers for SMMEs to access financial and non-financial support to start and/or grow businesses exist. • For some, B-BBEE is moving too slowly, and implementation needs to speed up- perhaps through the introduction of deadlines for meeting targets. Corruption and abuse of the system through fronting and improper procurement practises were raised as problem areas requiring resolution. • Many respondents agree that the current narrative or perceptions around B-BBEE are negative and should change. Some argued that a national campaign, similar to the HIV/AIDS campaign that was successful in South Africa, is needed to reposition B-BBEE in the minds of all South Africans. It is imperative to clarify to people what B-BBEE is really about. • Business believes there has been progress, but that more progress is needed when it comes to increasing black management control, upscaling skills development, entrenching enterprise development and broadening procurement to give opportunities to more black people, black women, and black youth; 22
Summary • The data on the B-BBEE Codes suggests that there may be reason for a realignment of prioritisation towards management control and enterprise development; • Successes include: • B-BBEE Act as amended provides a framework for implementing BEE policies in a more inclusive and broad-based manner; • Preferential procurement, although not without corruption challenges, has demonstrated success- steady growth in state procurement from black owned business, in 2021 stood at 38% (ZAR51,1 billion) and stood at 61% of all procurement by JSE firms in 2021; • Challenges include: • Reaching ownership targets. • The policy has led to the creation of a few very wealthy black millionaires and billionaires, while large numbers of black people remain excluded from the mainstream economy, in particular black women, and black youth; • However, institutional ownership accounts for a significant portion of black ownership at approximately 40 percent of the total shares listed on the JSE; • Distinction between empowerment-focused investors (investors with a track record of investing in companies with strong B-BBEE credentials) and non-empowerment-focused investors. In 2021, the survey found that empowerment-focused investors accounted for 11.3 percent of institutional ownership, up from 8.8 percent in 2019; • Questions remain for family owned firms, non listed large firms, firms that do not do business with the state and SMMEs. 23
High level economic impact assessment to review success and failure of the dtic family BEE & policies and programmes & BI 24
B-BBEE & BI Entities & Transactions approved by the dtic dtic entities 2009 to 2021 (audited) the Funding approved to B-BBEE and BI entities: [Blueprint interpretation of IDC data] • Entities and Transactions are measured, one entity may have a number of transactions, • Measured over two distinct time periods, with more detailed data of the second period from 2016 to 2021, • BI as a ‘sub-set’ of B-BBEE, meaning that all BI is included in B-BBEE (BI is not separate, or a duplicate), and • Woman and Youth as ‘sub-sets’ of B-BBEE and BI. The dtic Entities Funded B-BBEE Funded BI Funded Women Funded Youth Funded Entity Numbers: Transactions vs Entities B-BBEE Transactions 100.0% B-BBEE Entities BI BI Women Transactions Women Entities Youth Transactions Youth Entities Transactions Entities - - - - - - - - - - - - - - - - The dtic The IDC The NEF Total The dtic The IDC The NEF Total The dtic The IDC The NEF Total 682 702 462 507 969 - 435 558 993 - 826 631 448 214 662 - 206 242 448 - 467 456 923 332 160 492 - 163 233 396 - 324 249 573 261 53 314 - 157 56 213 - 233 109 342 185 35 220 - 132 50 182 - 189 53 242 2009/10 - 2015/16 (7 Years) 1,384 - 578 594 1,172 - 1,260 1,296 2,556 528 594 394 558 952 - 394 558 952 2016/17 - 2021/22 (6 Years) 1,122 - 528 594 1,122 43.9% 1.18 2009/10 - 2021/22 (13 Years) 1,457 100.0% 65.3% 36.1% 1.61 39.3% 13.4% 1.41 16.6% Group % of B-BBEE Funded Ratio: Transactions to Entities Note: The B-BBEE data is the 'grand total', with all other data as sub-totals within this grand total. Transactions refer to funding transactions, with entities being the entities that are funded. This data needs to be updated and confimed by the IDC in January 2023. 1.75 25 2024-05-17
B-BBEE & BI Funding approved ‘Per Sector’ by the dtic the dtic entities 2016 to 2021 (audited) Funding approved to B-BBEE and BI entities ‘Per Sector’: • The three dtic entities funding is analysed per sector, for totals, and for Economic Impact. • [‘Funding Approved’ percentages differ due to ‘current’ vs ‘constant 2021’ values in the underlying data.] B-BBEE Funding and Impact (2016/17 to 2021/22) [Constant 2021 Prices][Duplicates removed] B-BBEE Funding Approved (2016/17 to 2021/22) [Current Prices][Audited] The dtic Entities (6 Years) Funding Approved (R million) 13,062 25,756 Employment Impact (Number) 66,236 182,746 41,065 54,953 13,075 11,165 16,865 Economic sector the dtic Entities GDP Impact (R million) the dtic IDC NEF Agriculture Mining Manufacturing Electricity Construction Trade Transport Finance Personal services 122 - 4,662 - 267 422 85 51 629 719 992 4,713 10,896 16,976 5,185 142 1,509 1,663 365 735 10,947 22,467 5,185 848 3,355 1,936 1,052 3,027 25,532 84,197 2,127 7,227 15,289 3,065 1,046 7,176 829 - 439 1,784 249 502 562 5,789 981 3,796 2,174 1,271 3,246 62 24 186 1,730 5,693 Total 7,053 37,892 4,501 49,446 56,794 146,651 396,510 Source: Industrial Development Corporation (IDC), 11 January 2023. Estimation of the economy-wide impacts of the funding provided by the dtic group of entities for Broad-Based Black Economic Empowerment purposes and specifically for the development of Black Industrialists. Blueprint interpretation. [The IDC 'Economic Impact Assesment' is undertaken using audited data with the duplicates removed.] 26 2024-05-17
B-BBEE & BI Funding approved ‘Per Sector’ by the dtic the dtic entities 2016 to 2021 (audited) Funding approved to B-BBEE and BI entities ‘Per Sector’: • The three dtic entities funding is analysed per sector, for totals, and for Economic Impact. • [‘Funding Approved’ percentages differ due to ‘current’ vs ‘constant 2021’ values in the underlying data.] % of the dtic Entities (Current Prices) B-BBEE Funding Approved (2016/17 to 2021/22) % of the Totals (Constant 2021 Prices) B-BBEE Funding and Impact (2016/17 to 2021/22) The dtic Entities (6 Years) Funding Approved (R million) Employment Impact (Number) Economic sector the dtic Entities GDP Impact (R million) the dtic IDC NEF Agriculture Mining Manufacturing Electricity Construction Trade Transport Finance Personal services 19.4% 0.0% 20.8% 0.0% 31.5% 1.9% 1.3% 17.6% 57.2% 67.1% 99.5% 75.6% 100.0% 16.7% 45.0% 85.9% 34.7% 24.3% 13.5% 0.5% 3.7% 0.0% 51.8% 53.2% 12.9% 47.7% 18.6% 1.3% 22.1% 45.4% 10.5% 1.7% 6.8% 3.9% 2.1% 6.1% 1.3% 23.0% 45.4% 10.2% 1.7% 6.7% 3.8% 2.2% 5.7% 0.7% 17.4% 57.4% 1.5% 4.9% 10.4% 2.1% 0.7% 4.9% 1.2% 16.7% 46.1% 10.4% 13.9% 3.3% 2.8% 1.4% 4.3% Total 14.3% 76.6% 9.1% 100.0% 100.0% 100.0% 100.0% Source: Industrial Development Corporation (IDC), 11 January 2023. Estimation of the economy-wide impacts of the funding provided by the dtic group of entities for Broad-Based Black Economic Empowerment purposes and specifically for the development of Black Industrialists. Blueprint interpretation. Note: There is a difference in the precentage ratios for the 100% funding provided as the first metric is 'Current Prices', and the second is 'Constant 2021 Prices'. 27 2024-05-17
B B- -BBEE & BI BBEE & BI Funding Approved by ‘Groups & Sectors’ by the dtic the dtic entities 2016 to 2021 (audited) Funding approved to B-BBEE and BI entities by ‘Sector’ and ‘Groups’: • Woman and Youth are recorded separately (44.6%), with the balance being B-BBEE & BI (55.4%), • The ‘Manufacturing Sector’ is consistently highest, with Youth leading at 45.4% of total, • Woman score 33.8% in aggregate, against a lower 10.7% aggregate for youth. 28 2024-05-17