Download
1 / 11
110 likes | 199 Vues
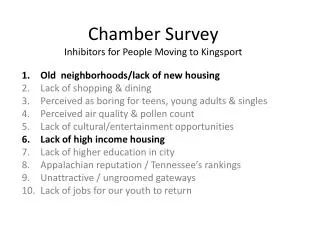
Chamber Survey Inhibitors for People Moving to Kingsport. Old neighborhoods/lack of new housing Lack of shopping & dining Perceived as boring for teens, young adults & singles Perceived air quality & pollen count Lack of cultural/entertainment opportunities Lack of high income housing

E N D
Chamber SurveyInhibitors for People Moving to Kingsport • Old neighborhoods/lack of new housing • Lack of shopping & dining • Perceived as boring for teens, young adults & singles • Perceived air quality & pollen count • Lack of cultural/entertainment opportunities • Lack of high income housing • Lack of higher education in city • Appalachian reputation / Tennessee’s rankings • Unattractive / ungroomed gateways • Lack of jobs for our youth to return
Looking back: 1990-2000 • From 1990-2000 • JC outbuilt Kingsport urban area by 1,488 homes • If homes ranged $200,000-$299,999 • Kingsport city property tax equivalency = $1,130 to $1,695 per home x 1,488 homes = $1.7 million to $2.5 million per year • Kingsport city sales tax equivalency 2.48 persons per household (TN, U.S. Census 2002) = 2.48 x 1,488 = 3,690 persons $10,382 retail sales per capita (TN, U.S. Census 2002) = $10,382 x 3,690 = $38,309,580 in lost retail sales x 2.5% = $958,000 per year
How important are newcomers? • Census Bureau releases an annual "Components of Population Change" for counties across the nation. • For 32 counties in the 5-state area of Tennessee, Virginia, North Carolina, Kentucky & West Virginia, • The region had a net natural population decline of 4,486 between 2000 and 2007 (this means there were more deaths than births). • However, 14,027 new residents moved into the region (1,210 were international). • So, how important are newcomers? VERY! Many parts of the U.S. are experiencing population decline, but no one is moving in to replace those that left -- leaving the local economy in a declining mode. • Fewer residents means fewer workers, a smaller economy, declining retail sales, a soft housing market, etc. • When newcomers move to a region, they bring their talent, resources, and disposable income! If they're retired, their income source is sheltered from ebbs and flows of the local economy.
Move To Kingsport 1,363 families from 40 states relocated to Kingsport during FY2009 • 4,757 families from 48 states since the beginning of MoveToKingsport.com (July 2006)* • 182 were new construction • 1,181 moved into existing structures • 69.75% chose to live inside the city limits of Kingsport • 59.9% of new construction was inside city limits of Kingsport Comparing this Fiscal Year with average FY 2007-2009: • New residential construction is down -38.02% • Out-of-state relocations to Kingsport are down -11.43%
Top 10 Places moving to Kingsport from >35 miles in pasts 3 years
Top 10 Places where Kingsporters moved in the past 3 years: Of note… neither Johnson City nor Bristol showed up on this list
Not too hot, ...not too cold …just right
Retail sales taxes generated by newcomers • 787 net new residential water connections (July 1, 2006 – June 30, 2009) • Census average = 2.3 persons per household • 787 x 2.3 = 1,810 new residents (with City water/Sullivan County/Kingsport zip code) • 69.75% located inside City limits • 69.75% x 1,810 = 1,262 estimated new city residents • $10,382 retail sales per capita (TN, U.S. Census 2002) • $10,382 x 1,810 = $13,107,015 in new retail sales • Local sales tax = 2.5% • 2.5% x $11,254,088 = $327,675 sales tax revenue per year (divided between City and Schools)
The EdinburghAn example of property taxes generated by newcomers • 2009: 15 housing units appraised by County at average of $353,720 each • $1,716 per year in City property taxes x 15 units = $25,733 annual revenue • $1,884 per year in County property taxes x 15 units = $28,253 annual revenue • 300 units at build-out (if valued at today’s rates) $1,716 City property tax x 300 units = $514,663 per year $1,884 County property tax x 300 units = $565,068 per year • 787 net new residential water connections (July 1, 2006 – June 30, 2009) • Census average = 2.3 persons per household • 787 x 2.3 = 1,810 new residents (with City water/Sullivan County/Kingsport zip code) • 59.9% located inside City limits • 59.9% x 1,810 = 1,084 estimated new city residents • $10,382 retail sales per capita (TN, U.S. Census 2002) • $10,382 x 1,084 = $11,254,088 in new retail sales • Local sales tax = 2.5% • 2.5% x $11,254,088 = $281,352 per year