Download
1 / 26
300 likes | 625 Vues
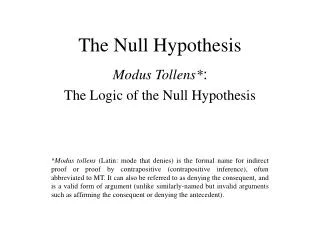
Presentation 7 H 0 The Null Hypothesis. (Click on the left mouse button to continue. Click on the right mouse button and select “Previous” to go back.). Focus. The following presentation will accomplish the following key objectives: To review what a scientific investigation is;

E N D
Presentation 7 H0The Null Hypothesis (Click on the left mouse button to continue. Click on the right mouse button and select “Previous” to go back.)
Focus The following presentation will accomplish the following key objectives: • To review what a scientific investigation is; • To define what a hypothesis is; • To introduce the difference between the Null and Alternative Hypotheses; • To introduce the concepts of Type I and Type 2 errors.
What is Scientific? • Scientific investigation involves the use of the scientific method and specific types of research designs. • A scientific investigation should lead to a scientific explanation of human behavior. • A scientific investigation is a cyclical process (see diagram on next page ...)
Cyclical Process Report the Results Define the Question Analyze the Data Design the Study Collect the Data
Let’s Focus on Defining the Question Report the Results Define the Question Analyze the Data Collect the Data Design the Study
Defining the Question • Read and understand the past literature related to your topic. What questions remain unanswered? • Formulate a testable Hypothesis based on your theory and the results from past studies. • A Hypothesis is a tentative statement concerning the relationship between variables of interest (Bordens and Abbott)
Example Hypothesis The more sleep a student has the night before an exam, the higher their grade on the exam. A B C D F Exam Grade 0 1 2 3 4 5 6 7 8 9 10 11 12 Sleep (hours)
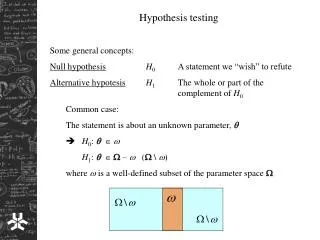
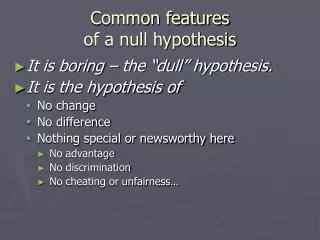
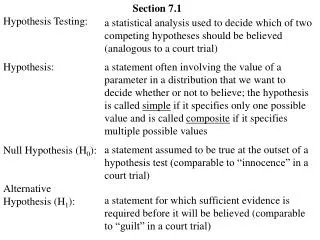
Two Kinds of Hypotheses • The AlternativeHypothesis, or H1 • Refers to the expected finding that study variables will be related in a meaningful way that is consistent with your theory and the results of past research. • The NullHypothesis, or H0 • Refers to the unexpected finding that study variables will not be related in a meaningful way that is consistent with your theory and the results of past research.
Example Hypotheses H1 = The more sleep a student has the night before an exam, the higher their grade on the exam. H0 = The amount of sleep a student has prior to an exam is not related to their grade on the exam.
Testing Hypotheses • Once you have identified your Alternative and Null Hypotheses, you are ready to move through the cyclical process of scientific investigation. • Testing your hypotheses occurs when you analyze the data you collected.
Focus on Analyzing the Data Report the Results Analyze the Data Define the Question Collect the Data Design the Study
Analyzing the Data • We move now to analyzing your study data to test hypotheses; • In a perfect world, any findings that demonstrate the expected relationship between study variables would support your alternative hypothesis. • For instance, if students who slept more before an exam got better grades, your alternative hypothesis would be supported.
But This Is Not a Perfect World! Why? • Sampling Error - Researchers are forced to study samples of people and these samples do not necessarily represent all people. • Measurement Error - The methods and tools that researchers use are fallible; they are not completely reliable. • Other Error
Probability - The Chance of Error Because this is NOT a Perfect World: • There is nothing DEFINITE. • Researchers are forced to evaluate the PROBABILITY that the results of a study are due to chance; • The Probability of a finding refers to the CHANCE that the finding is due to ERROR.
Hypothesis Testing (cont.) • Technically, researchers engaging in hypothesis testing are evaluating the probability that a finding rejects or fails to reject the null hypothesis. • If the null hypothesis is rejected and the finding is consistent with the alternative hypothesis, researchers say the alternative hypothesis was supported by the results. • NOTE: Researchers NEVER, EVER prove their hypothesis. Why? Because this is not a Perfect World.
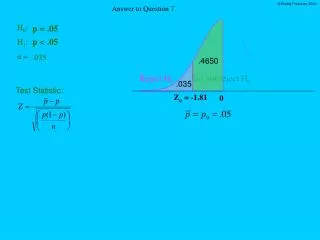
p < .05 • Many researchers have agreed on an acceptable level of chance risk to take in their research: 5 out of 100 • That is, if there is only a 5 in 100 chance that a finding is due to error, then researchers consider the finding to be statistically significant. • Hence, p < .05.
One-Tailed Test of Significance Critical region p < .05 z -1.65 -1 0 +1 +1.65
Two-Tailed Test of Significance Critical region Critical region p < .025 p < .025 z -1.96 -1 0 +1 +1.96
Making Errors • Researchers test their hypotheses using inferential statistics; • Because inferential statistics are based on probability theory, errors are sometimes made (e.g., 5 out of 100 findings are due to error); • There are two types of errors: Type 1 and Type 2;
Type 1 Error – REJECTING the null hypothesis when it is actually TRUE Perfect World H0 True H0 False Type 1 Error RejectH0 Study Findings Do Not Reject H0
Type 1 Error Example Concluding from your findings on sleep and exam performance thatthe more sleep a student has the night before an exam, the higher their grade on the exam (H1), when actually there is no relationship between amount of sleep and exam grade (H0).
Type 2 Error – NOT REJECTING the null hypothesis when it is actually FALSE Perfect World H0 True H0 False RejectH0 Study Findings Do Not Reject H0 Type 2 Error
Type 2 Error Example Concluding from your findings on sleep and exam performance thatthere is no relationship between amount of sleep and exam grade (H0), when actuallythe more sleep a student has the night before an exam, the higher their grade on the exam (H1).
Summary • Scientific investigation involves the use of the scientific method and specific types of research designs. • A hypothesis is a tentative statement concerning the relationship between variables of interest. • There are two types of hypotheses: the Null Hypothesis and the Alternative Hypothesis.
Summary (cont.) • Because this is not a Perfect World (errors occur in the study of human behavior) scientists use inferential statistics to test hypotheses; • Use of inferential statistics may lead to two types of errors: Type 1 and Type 2.
Disclaimer & Credits • These PowerPoint Presentations were created to supplement the materials presented in Psychology 202Q. They were not intended to replace attendance in lecture or lab. If any material in these presentations conflicts with what your instructor covers, always go with what s/he says. • The Psychology 202Q PowerPoint Presentations were created by Steven Rumery in 1998, and updated by Poom Nukulkij in Fall 2000. • For additional information, check out the Psychology 202Q Virtual Classroom at http://www.sp.uconn.edu/~ps202vc.