Download
1 / 7
80 likes | 204 Vues
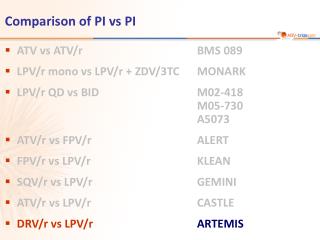
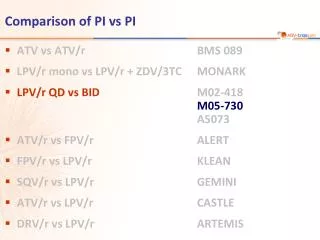
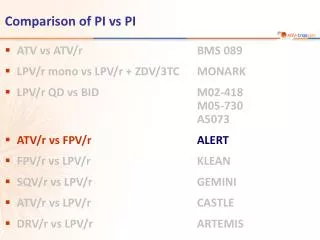
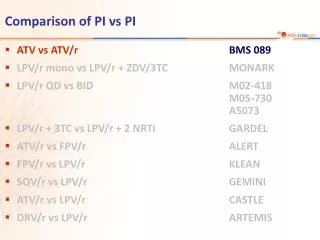
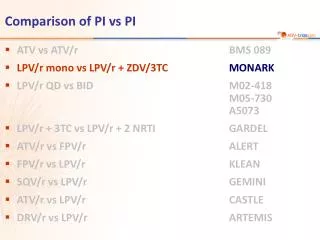
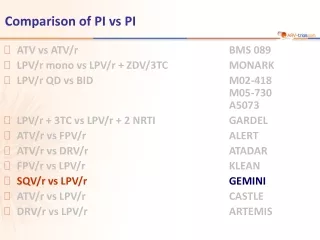
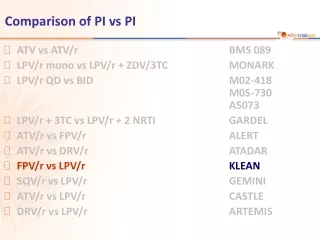
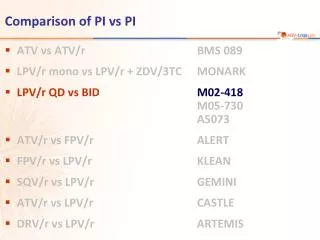
ATV vs ATV/r BMS 089 LPV/r mono vs LPV/r + ZDV/3TC MONARK LPV/r QD vs BID M02-418 M05-730 A5073 ATV/r vs FPV/r ALERT FPV/r vs LPV/r KLEAN SQV/r vs LPV/r GEMINI ATV/r vs LPV/r CASTLE DRV/r vs LPV/r ARTEMIS. Comparison of PI vs PI.

E N D
ATV vs ATV/r BMS 089 LPV/r mono vs LPV/r + ZDV/3TC MONARK LPV/r QD vs BID M02-418M05-730A5073 ATV/r vs FPV/r ALERT FPV/r vs LPV/r KLEAN SQV/r vs LPV/r GEMINI ATV/r vs LPV/r CASTLE DRV/r vs LPV/r ARTEMIS Comparison of PI vs PI
Study M02-418: LPV/r QD vs BID,in combination with TDF + FTC Objective Primary endpoint: HIV RNA < 50 c/mL at W48 (ITT, NC = F) Non-inferiority of LPV/r QD vs BID if lower margin of the 95% CIfor the difference = - 15% (> 60% power) M02-418 • Design Randomisation 3:2 Open-label N = 115 LPV/r 800/200 mg QD + TDF 300 mg + FTC 200 mg QD Adults > 18 years ARV-naïve or < 7 days prior ART HIV RNA > 1,000 c/mL Any CD4 cell count N = 75 LPV/r 400/100 mg BID + TDF 300 mg + FTC 200 mg QD Johnson MA. JAIDS 2006;43:153-60
Study M02-418: LPV/r QD vs BID, in combination with TDF + FTC M02-418 Patient disposition and baseline characteristics Note: LPV/r was administered as soft-gel capsules Johnson MA. JAIDS 2006;43:153-60
Study M02-418: LPV/r QD vs BID, in combination with TDF + FTC QD (N = 115) BID (N = 75) M02-418 Response to treatment at week 48 Primaryefficacyendpoint p = 0.67 % /mm3 100 200 196 185 80 160 71 70 65 64 60 120 40 80 20 40 0 0 ITT, NC = F TLOVR Mean CD4 increase 95% CI for the difference = - 7; 20 95% CI for the difference = - 8; 20 Johnson MA. JAIDS 2006;43:153-60
Study M02-418: LPV/r QD vs BID, in combination with TDF + FTC M02-418 Pharmacokinetics and resistance W4 steady-stadeLPV PK Genotyping and phenotyping were performed in all specimens with HIV RNA > 500 c/mLfrom W12 through W48 • BID group (N = 24) vs QD (N = 13) • Cmax and AUC24 not significantly different • Significantly lower Ctrough and Cminfor QD group (p < 0.003) • Median Ctrough: 4.37 µg/mL for QDvs 6.64 µg/mL for BID • Median IQ (Ctrough/IC50*) significantly lower for QD group (48.1) vs BID(86.5; p < 0.001) • * No specimen in 1 • ** Median HIV RNA = 625 c/mL • *** Any primary or active site mutation in protease at • codons 8, 30, 32, 46, 47, 48, 50, 82, 84, 90, with decrease in phenotypic susceptibility to LPV > 2.5 fold *Protein-binding adjusted IC50 for wild-type HIV-1 = 0.07 mg/mL Johnson MA. JAIDS 2006;43:153-60
Study M02-418: LPV/r QD vs BID, in combination with TDF + FTC M02-418 Safety and adverse events • Discontinuation for gastro-intestinal adverse events: QD (N = 9) vs BID (N = 2) • 1 death in BID group, unrelated to study drugs (adenocarcinoma) • W48 increase: LDL-cholesterol + 14 mg/dL in both groups; HDL-cholesterol: QD + 3 mg/dL vs BID + 6 mg/dL • LDL-cholesterol > 130 mg/dL: 14% at baseline vs 26% at W48 (2 groups combined) • HDL-cholesterol < 40 mg/dL: 58% at baseline vs 42% at W48 (2 groups combined) • GFR (MDRD [mL/min/1.73 m2)]: 112 at baseline, 104 at W48 (2 groups combined), p < 0.001, with no differences between groups. 1 case of acute renal failure in each group. * Occurring in > 3% of patients Johnson MA. JAIDS 2006;43:153-60
Study M02-418: LPV/r QD vs BID, in combination with TDF + FTC M02-418 • Summary - Conclusion • In previously untreated HIV-1 infected adults, LPV/r soft-gel capsule 800/200 mg QD was non inferior to LPV/r 400/100 mg BID, in combination with TDF + FTC QD • Virologic response rate at W48 (HIV RNA < 50 c/mL) was 70% in the QD group and 64% in the BID group • Immunologic recovery was similar in the 2 treatment arms • There were greater number of discontinuations for adverse events (primarily gastrointestinal) and a significantly higher rate of diarrhoea in the QD group • No significant differences in lipid changes was seen between the 2 groups • Most pronounced lipid effect was triglyceride elevation • Lipid increases were less than observed with LPV/r + thymidine analogues • Lack of LPV resistance emergence in either group • Lower Ctrough with LPV/r QD, not associated with reduced virologic response • Limitation of the study: only 60% power to determine non inferiority of LPV/r QD Johnson MA. JAIDS 2006;43:153-60