PC-NORDCAN version 2.4
430 likes | 565 Vues
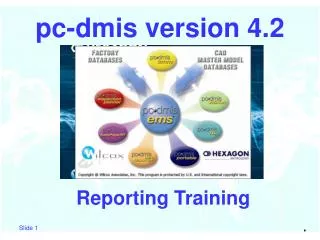
Sponsored by. Powered by. ANCR. PC-NORDCAN version 2.4. A PC based program for presentation of regional and national cancer incidence and mortality in the Nordic countries. Present facilities. Reference.

PC-NORDCAN version 2.4
E N D
Presentation Transcript
Sponsored by Powered by ANCR PC-NORDCAN version 2.4 A PC based program for presentation of regional and national cancer incidence and mortality in the Nordic countries. Present facilities
Reference Gerda Engholm, Jacques Ferlay, Niels Christensen, Freddie Bray, Marianne L. Gjerstorff, Åsa Klint, Elínborg Ólafsdóttir, Eero Pukkala and Hans H. Storm (2009). NORDCAN: Cancer Incidence and Mortality in the Nordic Countries, Version 2.4. Danish Cancer Society.
Authors/contact persons • Database and help file: Jacques Ferlay, IARC • Secretariat: Gerda Engholm, Hans Storm, Niels Christensen • Denmark: Marianne L. Gjerstorff • Finland: Eero Pukkala • Iceland: Elínborg Ólafsdóttir • Norway: Freddie Bray • Sweden: Åsa Klint
Variables • 41 groups of diagnoses coded according to common international rules • Gender • The 5 countries can be divided into counties (amt,fylke, län), total 81 regions • New geographical regions combining counties can be formed • 5 year age groups 0-4,…,85+ • Single years from 1972 to 2006
Graphs • Bar charts • Maps – all Nordic countries or one country • Line-charts of age-specific curves, trends in summary measures and trends by age or by birth cohorts • Pie charts for the 5-10 most common diagnoses • Population pyramids
Tables • Summary by sex, age, and period • Age specific by sex and period • User defined reports • Summary tables, all regions for one cancer or all cancers for one region • Age specific tables, all regions for one cancer or all cancers for one region
Export facilities • Graphs can be edited – font size, colour, age interval, log-scale • Graphs can be printed or copied to e.g. PowerPoint, Word, or saved in graphic files • Tables can be printed or saved for later use in e.g. Excel • Datasets containing numbers and risk time can be saved for statistical analysis in other programs (file -> export)
Graphs – example 2 Preselect: Standard/numbers Age interval Sex Incidence/mortality
Graphs – example 3 Select: Cancer Region
Graphs – example 4 Select: Title Line thickness Line symbol Colours
Graphs – example result Grid lines Log scale Age interval (some graphs) Text colour Background colour Font size Copy to clipboard Change line colour (left click)
Table – example 2 Select: Period Sex Data type
Table – example 3 Select: Cancer or population
Table – example 5 The 4 tables arranged ”Tiles Horizontally” ( click ”Window”)
Help function, registration+homepages hyperlinks
Comparable cancer data in the Nordic countries? • Sources of registration differ • Different classification systems between countries and over time • Even ICD7 codes vary between countries • Variation in included tumours • Non-melanoma skin cancer registration differ between countries and basal cell carcinoma is included in Denmark before 1978
NORDCAN entities • 41 groups of diagnoses - international dataset • The incidence data were first recoded to ICD-O-3 and ICD-10 and then converted into the NORDCAN entities • The mortality data were converted from various ICD systems (ICD-7, 8, 9 or 10) • Data are thus comparable between countries and periods, but might deviate a little from officially published data • New groups can be formed by combinations
IARC-products Some of the facilities in NORDCAN can also be found in products from IARC www-dep.iarc.fr • Cancer Incidence in Five Continents • GLOBOCAN • Cancer mortality database (WHO)
Price and size • NORDCAN can be downloaded free of charge from http://www.ancr.nu/nordcan.asp • System requirements:A 32-bit Pentium based PC running Microsoft® Windows 95/98/ME/NT/2000/XP/Vista (NT, 2000, XP, Vista recommended). 64 MB RAM (128 MB recommended). 50 MB hard-disc space required.Screen resolution set by 800x600 pixels or higher • Please register for notification on updates and for documentation of the use of the product
Web-version 3.4 on www.ancr.nu More facilities than PC-version • English and the five Nordic languages • Data from start of the registries to the latest published data for each country • Prevalence – number of cancer patients alive • Cancer stat fact sheets for each diagnosis Only countries – no division into counties Less flexible tables and figures