Download
1 / 16
160 likes | 178 Vues
Explore the communication of sea level rise and coastal flooding risks in New York City, focusing on climate change science integration for stakeholders through the New York City Panel on Climate Change (NPCC) efforts. Learn about the NPCC's advisory role, updated climate findings discussions, stakeholder engagement, and research outcomes. Dive into methodologies, trends in land ice masses, and potential ice sheet instabilities impacting sea level rise scenarios for the city's future resilience strategies. Discover specific case studies like Broad Channel in Queens, a vulnerable community facing critical adaptation challenges against rising sea levels. Explore actionable coastal adaptation options for a sustainable future.

E N D
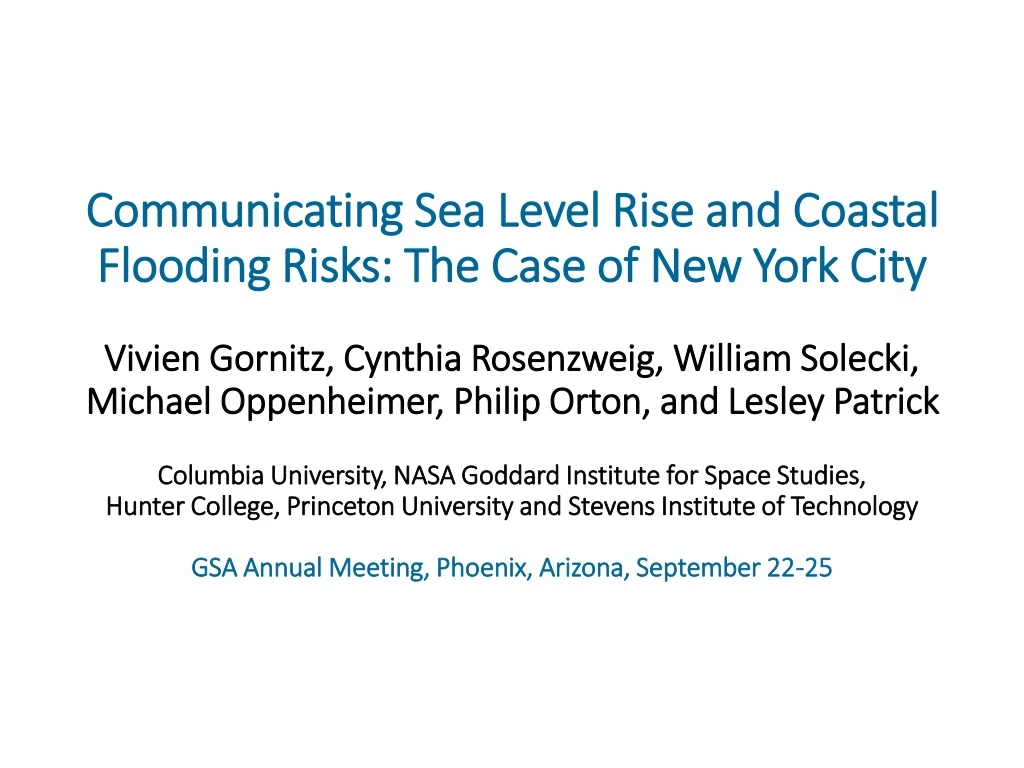
Communicating Sea Level Rise and Coastal Flooding Risks: The Case of New York CityVivien Gornitz, Cynthia Rosenzweig, William Solecki, Michael Oppenheimer, Philip Orton, and Lesley PatrickColumbia University, NASA Goddard Institute for Space Studies, Hunter College, Princeton University and Stevens Institute of Technology GSA Annual Meeting, Phoenix, Arizona, September 22-25
Co-generation of Climate Change Science for Stakeholders: The New York City Panel on Climate Change (NPCC) • NPCC advises city agencies on climate change risks and adaptations • NPCC discusses updated climate science findings with New York City stakeholdersperiodically • NYC government agencies, community groups, and NPCC meet to define new research goals for NPCC (2019) • Stakeholder feedback is incorporated into NPCC (2019) research program • NPCC (2019) investigates climate extremes: heat, cold, rainfall, sea level rise and coastal flooding • New tools developed for flexible adaptation pathways and resiliency: key indicators and monitoring of climate change • Integration of climate science into policy and planning
Review of NPCC (2015) Sea level Rise Methodology Multi-component approach: Oceanic temperature, salinity, and circulation changes Land ice mass losses and associated solid earth responses (“fingerprints”) Glacial isostatic adjustments (GIA) Land water storage changes Scenarios: RCP 4.5 and RCP 8.5; 24 CMIP5 GCMs Model-based distribution, literature, expert elicitation: 10th, 25th, 75th, and 90th percentiles SLR relative to 2000-2004 2020s, 2050s, 2080s, 2100 (decadal averages centered on mid-points)
Recent Trends in Land Ice Mass Losses • Glacier retreat: ~0.5 mm/yr SLR (1961-2016); ~0.9 SLR (2006-2016)—now nearly ~1/3 of current global mean SLR • Greenland Ice Sheet: 0.5 mm/yrSLR in the 2000s; ~0.8 mm/yr SLR (2010-2018) • Antarctic Ice Sheet: losses now exceed gains; ~0.5 mm/yr SLR 2000s; ~0.8 mm/yr SLR (2010-2018) • Potential West Antarctic Ice Sheet (WAIS) instability: a total WAIS meltdown raises global mean SLR by ~3m • Marine Ice Sheet Instability (MISI) • Hydrofracturing and Marine Ice Cliff Instability (MICI)
Potential West Antarctic Ice Sheet Instabilities Marine Ice Sheet instability (MISI) Marine Ice Cliff Instability (MICI) Photo: David Pollard; Robert DeConto After Bethan Davies, AntarcticGlaciers.org
Antarctic Rapid Ice Melt Scenario (ARIM)(NPCC 2019) • Mounting ice sheet losses and improved ice sheet-ocean-atmosphere models support need for extreme sea level rise scenarios • ARIM--a physically plausible, high-impact upper-end/low probability SLR scenario—supplements NPCC 2015 findings used by NYC • Includes potential West Antarctic Ice Sheet MISI and MICI destabilization (DeContoand Pollard, 2016) • Filters 250 ± 15 cm subset of 2000-2100 global-mean SLR projections (Sweet et al., NOAA, 2017; Kopp et al., 2017; DeConto and Pollard, 2016) • Other sea level components, except Antarctica, as in Kopp et al. (2014) • ARIM lies within NPCC 2015 10th-90th percentile range for 2020s and 2050s • Destabilization processes significant only by late 21st century in high emissions scenarios (e.g., RCP8.5)
Future New York City SLR NPCC (2015) vs ARIM (in, m) Sea Level Rise 10th25th75th90thARIM Scenario 2020s 2 4810 * 0.05 0.100.200.25 2050s 8 112130 * 0.20 0.280.530.76 2080s 13 18395881 0.33 0.460.991.472.07 2100 15 225075114 0.38 0.561.271.912.90 * ARIM scenario lies within pre-existing NPCC (2015) range for the 2020s and 2050s
Expansion of 100-yr Flood Zone with Sea LevelRise—Jamaica Bay Source: New York City Panel on Climate Change (2019)
Expansion of Monthly Tidal Flood Zone with Sea Level Rise—Jamaica Bay Source: New York City Panel on Climate Change (2019)
Broad Channel, Queens—a vulnerable community • Location: Island in Jamaica Bay, average elevation ≤ 5 ft • Population: ~2,500 • Housing: 1,100 buildings; 90% single-family detached; narrow lots • Transportation: Cross Bay Boulevard, MTA A-line subway • Current vulnerabilities: • Frequent street flooding • Main transportation corridor within current 100-yr flood zone • 700 buildings and 3 miles of streets at risk to 0.76 m SLR by 2050s (90th percentile; NPCC 2015) • limited protection options and high retrofitting costs Source: Resilient Neighborhoods—Old Howard Beach, Hamilton Beach, Broad Channel, NYC Planning (2016)
Broad Channel, Queens--street flooding NYC DCP Resilient Neighborhoods—Broad Channel
Broad Channel: Coastal Adaptation Options • Retrofit existing buildings for flood-resilience, raise “freeboard” by 1-2 ft* • Lower residential density and limit new construction* • Elevate frequently flooded streets and street edges* • Strengthen bulkheads; raise seawalls* • Restore saltmarshes; replant native vegetation; soften land-sea slope edge* • Build floating neighborhoods, multi-purpose levees; let canals replace streets • Buyouts; restore land to natural state (e.g., East Shore, Staten Island) • Managed relocation: When? Where to?
Jamaica Bay area—coastal adaptation measures Jamaica Bay—salt marsh restoration Broad Channel—planned street raising
Challenges of scientist-stakeholder communication • Differences in objectives • Scientists seek expansion of fundamental knowledge • City agencies need climate data for decision-making and planning • Differences in basic methodology and language • Scientists use climate models and observational data; highly technical • City stakeholders need practical solutions in simple English • Delays and insufficiencies in funding • Basic research often hampered by funding delays and tight budgets • Challenges to science findings (SLR) • Implications of extreme sea level rise proved controversial • Models upon which ARIM was based are still uncertain and likely to change • Resistance to adaptation of ARIM scenario so soon after the “official” NPCC 2015 report • Balancing responses to stakeholders’ questions with limitations to current scientific knowledge
Implementation of NPCC Climate Science in NYC Resiliency Programs • NYC Flood Hazard Mapper—interactive flood map (NYC Department of City Planning, November 2017;based on NPCC 2015 SLR projections) • Climate Resiliency Design Guidelines (NYC Mayor’s Office of Recovery and Resiliency, March 2019) • NPCC 2015 climate change projections (T, Ppt, SLR) guide design of NYC capital projects • Time period of projection linked to useful lifespan of infrastructure • Design guidelines recommend resiliency measures for increased sea levels • Flood Hazard Mapper assesses tidal or storm inundation risks • Outlines a 7-step Risk Assessment Methodology • Recommends a benefit-cost analysis • Suggests climate mitigation alternatives