Download
1 / 22
220 likes | 325 Vues
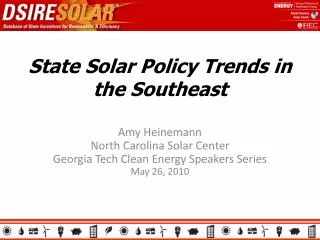
State Solar Policy Trends in the Southeast. Amy Heinemann North Carolina Solar Center Georgia Tech Clean Energy Speakers Series May 26, 2010. DSIRE Project Overview. Created in 1995 Funded by DOE / NREL Managed by NCSU; works closely with IREC

E N D
State Solar Policy Trends in the Southeast Amy Heinemann North Carolina Solar Center Georgia Tech Clean Energy Speakers Series May 26, 2010
DSIRE Project Overview • Created in 1995 • Funded by DOE / NREL • Managed by NCSU; works closely with IREC • Scope: government & utility policies/programs that promote RE/EE deployment • > 2,300 total summaries • DSIRE Solar
DSIRE Solar • Interactive Policy Map: Provides quick access to state-specific solar information • Solar Policy Guide: Offers descriptions of various state and local policy types for promoting solar; status and trends of individual policies; specific policy examples; and links to additional resources • Summary Maps: Provide geographical overview of incentives across the country • Solar Policy Comparison Tables: Highlight individual elements of state rebate and tax credit programs • Search Function: Allows users to create a custom list of programs by solar technology, incentive type, eligible sector, etc.
“Traditional” Solar Policy Options State Financial Incentives State Regulatory Policies • Rebate Programs • Production Incentives • Corporate Tax Credits • Personal Tax Credits • Grant Programs • Ind. Recruitment/Support • Loan Programs • Property Tax Incentives • Sales Tax Incentives • Public Benefits Funds (PBFs) • Renewable Portfolio Standards (RPSs) • Solar/DG Carve-Outs • Net Metering • Interconnection Standards • Solar Access Laws • Contractor Licensing
Direct Cash Incentives for Solar Projects www.dsireusa.org / February 2010 NH U VT U U MA U U U U RI U U U U U U U U DC U U U U U U U U U U U U.S. Virgin Islands U U Puerto Rico U U 26 states +DC & USVI offer direct cash incentives for solar projects State Direct Cash Incentives for PV State Direct Cash Incentives for Solar Water Heating State Direct Cash Incentives for both PV and Solar Water Heating Utility Direct Cash Incentive(s) for PV and/or Solar Water Heating U
State Tax Credits for Solar Projects www.dsireusa.org / February 2010 DC 21 states + PR offer tax credits for solar projects Incentives for Residential Projects Incentives for Commercial Projects Puerto Rico Incentives for Residential and Commercial Projects Applies to Solar Electric only
Renewable Portfolio Standards www.dsireusa.org / April 2010 ME: 30% x 2000 New RE: 10% x 2017 VT: (1) RE meets any increase in retail sales x 2012; (2) 20% RE & CHP x 2017 WA: 15% x 2020* MN: 25% x 2025 (Xcel: 30% x 2020) MT: 15% x 2015 NH: 23.8% x 2025 MI: 10% + 1,100 MW x 2015* MA: 22.1% x 2020 New RE: 15% x 2020(+1% annually thereafter) ND: 10% x 2015 OR: 25% x 2025(large utilities)* 5% - 10% x 2025 (smaller utilities) WI: Varies by utility; 10% x 2015 statewide SD: 10% x 2015 RI: 16% x 2020 NY: 29% x 2015 CT: 23% x 2020 NV: 25% x 2025* IA: 105 MW OH: 25% x 2025† PA: ~18% x 2021† CO: 30% by 2020(IOUs) 10% by 2020 (co-ops & large munis)* WV: 25% x 2025*† IL: 25% x 2025 NJ: 22.5% x 2021 CA: 33% x 2020 KS: 20% x 2020 UT: 20% by 2025* VA: 15% x 2025* MD: 20% x 2022 MO: 15% x 2021 DE: 20% x 2020* AZ: 15% x 2025 DC NC: 12.5% x 2021(IOUs) 10% x 2018 (co-ops & munis) DC: 20% x 2020 NM: 20% x 2020(IOUs) 10% x 2020 (co-ops) TX: 5,880 MW x 2015 HI: 40% x 2030 29 states + DC have an RPS (6 states have goals) State renewable portfolio standard Minimum solar or customer-sited requirement * State renewable portfolio goal Extra credit for solar or customer-sited renewables † Solar water heating eligible Includes non-renewable alternative resources
Renewables PortfolioStandards, 1997 ME: 30% by 2000 MN: 425 MW by 2002 MA (under development) IA: 105 MW by 1999 NV: 1% by 2009 AZ: 1.1% by 2007
RPS Policies with Solar/DG Provisions www.dsireusa.org / April 2010 WA: double credit for DG NH: 0.3% solar- electric x 2014 OR: 20 MW solar PV x 2020; double credit for PV MI: triple credit for solar- electric MA: 400 MW PV x 2020 NY: 0.4788% customer- sited x 2015 OH: 0.5% solar-electric x 2025 NJ: 5,316 GWh solar- electric x 2026 NV: 1.5% solar x 2025; 2.4 - 2.45 multiplier for PV CO: 3.0% DG x 2020 1.5% customer-sited x 2020 IL: 1.5% PVx 2025 PA: 0.5% PV x 2020 WV: various multipliers UT: 2.4 multiplier for solar-electric DE: 2.005% PV x 2019; triple credit for PV DC MO: 0.3% solar-electric x 2021 NC: 0.2% solarx 2018 AZ: 4.5% DG x 2025 MD: 2% solar-electric x 2022 DC: 0.4% solar x 2020 NM: 4% solar-electric x 2020 0.6% DG x 2020 TX: double credit for non-wind(non-wind goal: 500 MW) 16 states + DC have an RPS with solar/DG provisions State renewable portfolio standard with solar / distributed generation (DG) provision State renewable portfolio goal with solar / distributed generation provision Solar water heating counts toward solar provision
Net Metering • Customer stores any excess electricity generated, usually in the form of a kWh credit, on the grid for later use • Available “statewide” in 43 states, DC, & PR • Around 20 states + DC allow 1 MW or greater (super-sized net metering) • IREC model rules: www.irecusa.org • Freeing the Grid 2009, November 2009 www.newenergychoices.org
Net Metering www.dsireusa.org / May 2010 ME: 660co-ops & munis: 100 WA: 100 MT: 50* ND: 100* VT: 250 OR: 25/2,000* MN: 40 NH: 100 WI: 20* MA: 60/1,000/2,000* MI: 150* WY: 25* RI: 1,650/2,250/3,500* IA: 500* CT: 2,000* NE: 25 OH:no limit* NV: 1,000* IL: 40* NY: 10/ 25/500/2,000* UT: 25/2,000* WV: 25 IN: 10* PA: 50/3,000/5,000* CA: 1,000* KS: 25/200* VA: 20/500* CO: no limitco-ops & munis: 10/25 NJ: 2,000* KY: 30* DC MO: 100 NC:1,000* DE: 25/500/2,000* OK: 100* AZ: no limit* MD: 2,000 AR: 25/300 NM: 80,000* DC: 1,000 GA: 10/100 LA: 25/300 AK: 25* 43 states + DC & PR have adopted a net metering policy FL: 2,000* HI: 100KIUC: 50 State policy Voluntary utility program(s) only PR: 25/1,000 * State policy applies to certain utility types only (e.g., investor-owned utilities) Note: Numbers indicate individual system capacity limit in kW. Some limits vary by customer type, technology and/or application. Other limits might also apply.
Interconnection Standards • Technical issues (safety, power quality, system impacts) largely resolved • Policy issues (legal/procedural) improving • IREC model rules: www.irecusa.org • Freeing the Grid 2000, November 2009 www.newenergychoices.org
Interconnection Standards www.dsireusa.org / March 2010 WA: 20,000 MT: 50* ME: no limit MN: 10,000 VT: no limit NH: 100* OR: 10,000 NY: 2,000 WI: 15,000 MA: no limit SD: 10,000 MI: no limit CT: 20,000 WY: 25* PA: 5,000* NJ: no limit NE: 25* IN: no limit NV: 20,000 MD: 10,000 OH: 20,000 CO: 10,000 IL: 10,000 DC: 10,000 CA: no limit VA: 20,000 KS: 25/200* UT: 25/2,000* DC MO: 100* KY: 30* NC: no limit SC: 20/100 AR: 25/300* NM: 80,000 GA: 10/100* 38 States + DC & PR have adopted an interconnection policy LA: 25/300* TX: 10,000 HI: no limit FL: 2,000* State policy * PR: no limit Standard only applies to net-metered systems Notes: Numbers indicate system capacity limit in kW. Some state limits vary by customer type (e.g., residential/non-residential).“No limit” means that there is no stated maximum size for individual systems. Other limits may apply. Generally, state interconnection standards apply only to investor-owned utilities.
Federal Incentives Top State Solar Spending, ARRA-SEP • ARRA Funded Programs – vary state-to-state • US Department of Treasury Renewable Energy Grants (1603 grants, cash in lieu of tax credit) • Business Energy Investment Tax Credit • Accelerated Depreciation (MACRS)
Installed U.S. PV Capacity (through 12/31/08) Source: www.irecusa.org, May 2009
Emerging Trends – PACE Financing • PACE financing = property assessed clean energy financing • Property owners borrow money from the local government to pay for renewable energy and/or energy efficiency improvements • Loan typically repaid on property tax bill (or water, sewer, utility) • Loan legally transfers with property • Opt-in special assessment feature • Loan secured by lien on property • Administered by local government, but generally requires state authorization
Property Assessed Clean Energy (PACE) www.dsireusa.org / April 2010 ME: 2010 MN: 2010 NY: 2009 OR: 2009 VT: 2009 WI: 2009 NV: 2009 OH: 2009 MD: 2009 IL: 2009 CO: 2008 DC CA: 2008 VA: 2009 NC: 2009 NM: 2009 OK: 2009 TX: 2009 20 states authorize PACE (18 states have passed legislation and 2 states permit it based on existing law) LA: 2009 FL: Existing Authority* HI: Existing Authority* PACE financing authorized
Timeline of PACE • In 2008, 2 states passed PACE legislation. • In 2009, 14 states passed PACE legislation and 2 more appeared to have existing authorization. Legislation in 19 states. • In 2010, 2 states passed PACE legislation.* 3 states modified PACE. Legislation in 29 states. *4 more states have legislation waiting to be signed by governor: CT, FL, GA, MO
Conclusions • Dominance of RPS policies • Super-sized net metering • Surging interest in FITs • Rapid adoption of PACE financing • New financial & policy models • Calibrating state/federal policy • Distributed v. centralized PV • Increasing policy complexity Trends/Issues Need for Improvement • Utility rate structures • REC markets • Incentives for non-taxpayers • National market coordination • Legal clarification: 3rd party sales, PACE financing • Bureaucracy
Questions? Amy HeinemannN.C. Solar Center / DSIRENCSU, Box 7409919.515.5693amy.heinemann@ncsu.eduwww.dsireusa.org www.dsireusa.org/solar