Download
1 / 52
520 likes | 626 Vues
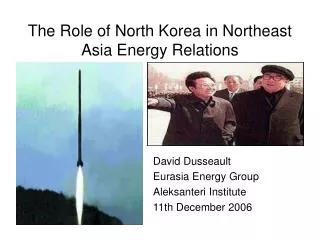
Meeting of Energy Futures and Energy Cooperation in the Northeast Asia Region. By: Dr. Pham Khanh Toan & Nguyen Minh Bao Institute of Energy. Viet Nam- Country Report. 23-24 September-Beijing-China. Contents. Introduction

E N D
Meeting of Energy Futures and Energy Cooperation in the Northeast Asia Region By: Dr. Pham Khanh Toan & Nguyen Minh Bao Institute of Energy Viet Nam- Country Report 23-24 September-Beijing-China
Contents • Introduction • Recent Changes in Energy Sector and Policies • Work Progress and Interim Results of LEAP Paths • Conclusions and Recommendations
1. Introduction • Viet Nam stretches along the east coast of Indochina over a length of 1,600 km between the northern latitudes of 80 and 230. • Total land area: 330,000 square kilometers. • Shares common borders with the People’s Republic of China (PRC) in the north, and with Laos and Cambodia in the west.
Population: 2009: 85.8 million (result from the general population census in 01 April 2009). From 1999 to 2009: Population were increased by 9.5 million with an average growth rate of 1.18% per year, reducing nearly 0.5% compared with previous 10 year period (1989-1999). GDP: . Annual average GDP Growth Rate: 7.6% in 1990-2005, and 7.3% in 2005-2009. Introduction
Current Status and Recent Trends in Energy Sector • Total energy consumption in 1990 was 16,760 KTOE and increased to 40,345 KTOE in 2007 with average growth rate of 5.3 percent per year. Total Energy Use by Sector 1990-2007,(including Biomass Energy)
Current Status and Recent Trends in Energy Sector • In 2007, residential sector consumes 39% of total final energy, followed by industry (36%), • transportation (20%), • commerce (4%) and agriculture (1%). • The share of energy consumption by sector in 2007.
market share of installed capacity - 2010 By owners By fuel types
Gas turbine Oil thermal Coal thermal HPP installed capacity vs peak demand 2006-:-2010 Power Generation: 13,5%/annual Growth of Peak Demand: 11,6%/ann. Growth of Installed Cap.: 12%/ann.
Electricity production in 2001-2009 Average growth rate of electricity is 12.8%/year in 2006-2009 (including electricity from China ). 10
Volume of transmission network as of 2009 500 kV 16/7500 MVA 3438 km 220 kV 8497 km 119/19094 MVA 110 kV 12145 km 746/25862 MVA • Rate of rural electrification as of end of 2009 • 100% districts have electricity from national grid or local system • 97.6% communes (8880/9101 communes); and • 95,1% rural households have electricity from grid (13.95/14.67 mill. hh) 11
Viet Nam’s Energy Policy National Energy Saving & Target • In April 2006, the Prime Minister of Viet Nam signed Decision No. 79/2006/QD-TTg approving the EE&C program for the period 2006-2015. • The target of the program is to save 3 to 5 percent of total national energy consumption over the period 2006-2010 and 5 to 8 percent in period 2011-2015.
Viet Nam’s Energy Policy • National Energy Efficient Use Policies • In July 2010, the Law on Energy Conservation and Efficient Use was passed by the National Assembly. • The Law includes 12 chapters, 48 articles to institutionalize policies on national energy resources, energy security, environment protection and meeting demand of socio-economic development. • The Law specifies the responsibilities of sectors with high energy saving potential such as industry, transport, service and residential. • The Law stipulated that large energy-consuming industries and buildings have to report on energy consumption and plans to improve efficiency, and to designate internal energy managers responsible for energy-efficiency work.
Viet Nam’s Energy Policy • Target Sectors for Promoting Energy Efficiency: • Three sectors account for about 95% of total final energy consumption, with high potential for energy efficiency: • Industry:Consumption grew from 4,663 KTOE in 1990 to 14,359 KTOE in 2007, annual growth rate of 6.8% per year, accounting for 27.8% of total energy consumption in 1990 and increased to 35.6% in 2007. • Transportation: consumption grew from 1,413 KTOE in 1990 to 8,671 KTOE in 2007, annual growth rate of 11.3% per year. • Residential: Household use of modern energy (such as LPG and electricity) has average growth rate of 16.3% per year during 1990–2007.
Viet Nam’s Energy Policy • Main Measurements for Energy Efficiency in Target Sectors • a, Industrial Sector: • - Renewal and renovation of existing equipment and facilities. • - Selecting the suitable measures for energy use management. • Planning access to energy-efficient equipments, modern production lines. • Select high efficient technologies for new power plants. • b, Transport Sector: • - Means of transportation must comply with the technical standards • - Improvement and promotion of using public transport system. • Development and using clean and other substitution fuels. • c, Residential and Commercial Sector: • - Energy efficient use in buildings, lighting systems and residential sectors. • - Introduction of energy-saving appliances, renewable energy in households and commercial buildings, along with management measurements.
Viet Nam’s Energy Policy • National Policies in Nuclear Energy • In January 2006, the Prime Minister approved “Sstrategy to apply nuclear energy for peaceful purposes by 2020”. • In April 2008, the Institute of Energy prepared an Investment Report on construction of nuclear power plants in NinhThuan province. • The Investment Report of the first nuclear power plant project in PhuocDinh and VinhHai, NinhThuan province, 4000 MW, was approved by the National Assembly in November 2009. At each site, two nuclear units with capacity of 1000 MW each, operation anticipated in 2020.
Viet Nam’s Energy Policy • National Policies in Nuclear Energy • In June 2010, the Prime Minister approved “Orientation planning for nuclear energy development up to the year 2030”. • Three phases of NPP development: • - The first phase (by 2015): Approval of investment project, selecting sites and contractors, and training the human resource; Preparing mechanisms, policies on for project construction and management. • The next five year stage (by 2020), the first unit of the NinhThuận Nuclear Power Plant 1 (1000MW) will be finished and put into operation by 2020. The second plant will also be built during this period.
Viet Nam’s Energy Policy • National Policies in Nuclear Energy • The phase 3: 2020-2030, next nuclear power plants will be built • According to the development orientation, about eight sites for power plants located in five provinces of Ninh Thuan, Binh Dinh, Phu Yen, Ha Tinh and Quang Ngai. • Up to 2030: Total NPP capacity will be 8,000 MW by 2025 and 15,000 MW by 2030, accounting for about 10 percent of the total capacity of power system.
Introduction • In EASS Project, LEAP was used as a tool for energy demand projection, and development of alternative energy scenarios addressing climate change problems. • This section will provide the progress and interim results of LEAP Paths including: • Methodology and Data • Energy Demand Structure • Key Assumptions • Interim results of LEAP Paths.
Methodology and Data • Energy demand was constructed and projected for the sectors such as industry, transport, agriculture, residential and commercial sectors . • In each sector, energy consumption was broken down in to sub-sectors and projected based on driving activities and energy intensities. • Driving activities were chosen based on the development plans or strategies of subsectors. • Energy intensities were selected based on the available data from the researches and recent surveys. • Nuclear capacity scenarios were developed based on the programs of the country.
Energy Demand Structure Cooking Cooking Urban Lighting Refrigeration Refrigeration Residential Air Conditioners Air Conditioners Rural Lighting
Energy Demand Structure Blast Furnaces Rotary Kilns Heat Clinker Product Clinker Product Iron and Steel Electricity Cement Product Electricity Cement Product Industry Elec. Arc Furnaces Vertical Kilns Cement
Energy Demand Structure Coal Kilns Pulp Heat Heat Brick Making Electricity Electricity Industry Paper Rice Husk Kilns Pulp & Paper Others
Train Energy Demand Structure Train Bus Truck Road Road Car Passenger Motorbike Railway Transport Railway Maritime Vessel Aviation Air plane Freight Waterway Boat Others
Energy Demand Structure Electric Pump Irrigation Agriculture DO Pump Tractors Land Preparation Mechanized rate Sea Catching Mechanized rate Ships
Key Assumptions • GDP: Viet Nam’s GDP is projected to grow at an average annual rate of 6.9%, 7.2% and 7.0% in the periods of 2005-2010, 2011-2020 and 2021-2030 respectively in the base case scenario. • Population Growth Assumption • Urbanization rate: 44.5% in 2030
Key Assumptions Nuclear Power Plant Development Scenarios Updated Unit: MW
Interim Results Final Energy Demand by Fuels (KTOE)
Interim Results Final Energy Demand by Sectors (KTOE)
Interim Results Residential: Final Energy Demand by Sub-sectors (KTOE)
Interim Results Industry: Final Energy Demand by Sub-sectors (KTOE)
Interim Results Industry: Final Energy Demand by Fuels (KTOE)
Interim Results Transport: Final Energy Demand by Sub-sectors (KTOE)
Interim Results Transport: Final Energy Demand by Fuels (KTOE)
Interim Results Electricity Generation: Output by Fuels -BAU (KTOE)
Interim Results Electricity Generation: Global Warming Potential (Mil. Tone CO2e)
Conclusions • As shown above, an interim result was achieved based on the updated data on energy, economics and main driving activities. • Energy demand of residential, industry, and transport sectors was broken down in to sub-sectors and end-uses. • Energy demand was projected based energy consumption indexes and driving activities referred from the development strategies of sectors and sub-sectors. • GHG Mitigation Scenarios were developed based on the BAU, maximum and minimum scenarios on nuclear power development.