
3’UTR
3’UTR. LOC_Os02g02710 AAGGCTAGTG C * ACA A ACA ACATCTTGTT LOC_Os07g01950 AGAAGATTGG C * ACACACA ATACGAAACA LOC_Os07g46590 AGCAGATGTA C * ACACACA AGATTCTTCT LOC_Os05g41480 CTGATCCTGG C * ACACACA AATTGGGTAT LOC_Os04g34440 CTTTTTTGTA C * ACACACA CCTTGTGGTT

3’UTR
E N D
Presentation Transcript
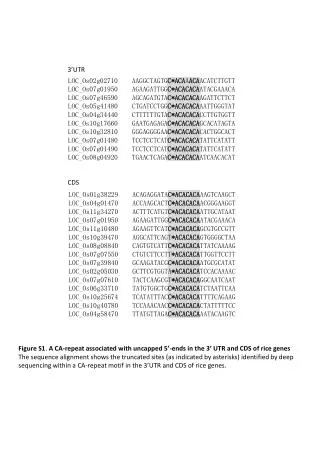
3’UTR LOC_Os02g02710 AAGGCTAGTGC*ACAAACAACATCTTGTT LOC_Os07g01950 AGAAGATTGGC*ACACACAATACGAAACA LOC_Os07g46590 AGCAGATGTAC*ACACACAAGATTCTTCT LOC_Os05g41480 CTGATCCTGGC*ACACACAAATTGGGTAT LOC_Os04g34440 CTTTTTTGTAC*ACACACACCTTGTGGTT LOC_Os10g17660 GAATGAGAGAC*ACACACAGCACATAGTA LOC_Os10g32810 GGGAGGGGAAC*ACACACACACTGGCACT LOC_Os07g01480 TCCTCCTCATC*ACACACATATTCATATT LOC_Os07g01490 TCCTCCTCATC*ACACACATATTCATATT LOC_Os08g04920 TGAACTCAGAC*ACACACAATCAACACAT CDS LOC_Os01g38229 ACAGAGGATAC*ACACACAAAGTCAAGCT LOC_Os04g01470 ACCAAGCACTC*ACACACAACGGGAAGGT LOC_Os11g34270 ACTTTCATGTC*ACACACAATTGCATAAT LOC_Os07g01950 AGAAGATTGGC*ACACACAATACGAAACA LOC_Os11g10480 AGAAGTTCATC*ACACACAGCGTGCCGTT LOC_Os10g39470 AGGCATTCAGT*ACACACAGTGGGGCTAA LOC_Os08g08840 CAGTGTCATTC*ACACACATTATCAAAAG LOC_Os07g07550 CTGTCTTCCTT*ACACACATTGGTTCCTT LOC_Os07g39840 GCAAGATACGC*ACACACAATGCGCATAT LOC_Os02g05030 GCTTCGTGGTA*ACACACATCCACAAAAC LOC_Os07g07610 TACTCAAGCGT*ACACACAGGCAATCAAT LOC_Os06g33710 TATGTGGCTGC*ACACACATCTAATTCAA LOC_Os10g25674 TCATATTTACC*ACACACATTTTCAGAAG LOC_Os10g40780 TCCAAACAACC*ACACACACTATTTTTCC LOC_Os04g58470 TTATGTTAGAC*ACACACAAATACAAGTC Figure S1. A CA-repeat associated with uncapped 5’-ends in the 3’ UTR and CDS of rice genes The sequence alignment shows the truncated sites (as indicated by asterisks) identified by deep sequencing within a CA-repeat motif in the 3’UTR and CDS of rice genes.
Frequency 1234512345 12345 cDNA NPBs SC938 INF939 Position (3’->5’) Figure S2. Bias of base composition in the 3’-end of rice SC938 degradome reads Base composition for the last five nucleotides of all unique degradomereads in rice SC938, INF939 and NPBs libraries were analysed along with that of rice cDNA as a reference.
A B Arabidopsis AxIRP snoRNA 202(287) Arabidopsis AxIDT snoRNA 174(287) Arabidopsis TWF snoRNA 236(287) Arabidopsis Tx4F snoRNA 254(287) Locus Locus C D Locus Locus Arabidopsis AxSRP snoRNA 181(287) Arabidopsis ein5 snoRNA 110(287) Locus Locus E F Arabidopsis Col-0 snoRNA 100(287) -10-9-8-7-6-5-4-3-2-112345678910 -10-9-8-7-6-5-4-3-2-112345678910 -10-9-8-7-6-5-4-3-2-112345678910 -10-9-8-7-6-5-4-3-2-112345678910 -10-9-8-7-6-5-4-3-2-112345678910 -10-9-8-7-6-5-4-3-2-112345678910 -10-9-8-7-6-5-4-3-2-112345678910 Position Position Position Position Position Position Position Locus G Figure S3. The 5’-ends of Arabidopsis snoRNAs captured by three sequencing approaches Normalized reads produced around the 5’-ends of Arabidopsis snoRNAs with deep sequencing data derived from the PARE method (A-B), degradome sequencing (C-E), and GMUCT method (F-G) are visualized by cluster heat maps. The first nucleotide of a snoRNA was set to 1. The number of loci shown in each heat map is indicated with the number of total snoRNA loci shown in parentheses. Loci were clustered based on the distribution of normalized read numbers across the 20-nt region by Ward’s method.
A B Arabidopsis AxIRP 3’UTR 266(2278) Arabidopsis AxIDT 3’UTR 211(2278) Locus Locus C D -10-9-8-7-6-5-4-3-2-112345678910 TGTAHAKA Position -10-9-8-7-6-5-4-3-2-112345678910 TGTAHAKA Arabidopsis ein5 3’UTR 386(2278) Position Arabidopsis AxSRP 3’UTR 249(2278) Locus E F Locus -10-9-8-7-6-5-4-3-2-112345678910 TGTAHAKA Position -10-9-8-7-6-5-4-3-2-112345678910 TGTAHAKA Position Arabidopsis TWF 3’UTR 1020(2278) Arabidopsis Col-03’UTR 226(2278) Locus G Locus -10-9-8-7-6-5-4-3-2-112345678910 TGTAHAKA Position -10-9-8-7-6-5-4-3-2-112345678910 TGTAHAKA Position Arabidopsis Tx4F 3’UTR 907(2278) Figure S4. Position-specific enrichment of uncapped 5′-ends surrounding putative PUF binding sites across Arabidopsis degradome libraries Distribution of normalized reads around putative PUF binding sites (TGTAHAKA) in the 3′ UTR of Arabidopsis genes for deep sequencing data derived from the PARE method (A-B), degradome sequencing (C-E), and GMUCT method (F-G). The PUF motif was boxed with the first nucleotide set to 1. Loci containing the PUF motif were identified from the 3′ UTR of all annotated genes and the number is shown in parenthesis above the heat map. Only loci with a total read number greater than five in the 20-nt region are shown and the number of loci in each heat map is also indicated above the heat map. Loci were clustered based on the distribution of normalized read numbers across the 20-nt region by Ward’s method. Locus -10-9-8-7-6-5-4-3-2-112345678910 TGTAHAKA Position
A B C D Figure S5. Position-specific enrichment of uncapped 5′-ends surrounding putative PUF binding sites across rice PARE libraries Distribution of normalized reads around putative PUF binding sites (TGTAHAKA) in the 3′ UTR of rice genes for four PARE libraries. The PUF motif was boxed with the first nucleotide set to 1. Loci containing the PUF motif were identified from the 3′ UTR of all annotated genes and the number is shown in parenthesis above the heat map. Only loci with a total read number greater than five in the 20-nt region are shown and the number of loci in each heat map is also indicated above the heat map. Loci were clustered based on the distribution of normalized read numbers across the 20-nt region by Ward’s method. Rice INF9311a 3’UTR 1680(4404) Locus -10-9-8-7-6-5-4-3-2-112345678910 TGTAHAKA Position Rice NPBs 3’UTR 3027(4404) Locus Rice INF939 3’UTR 990(4404) -10-9-8-7-6-5-4-3-2-112345678910 TGTAHAKA Position Locus Rice SC938 3’UTR 767(4404) -10-9-8-7-6-5-4-3-2-112345678910 TGTAHAKA Position Locus -10-9-8-7-6-5-4-3-2-112345678910 TGTAHAKA Position
Arabidopsis AxIRP 3’UTR 94(1189) Arabidopsis AxIDT 3’UTR 88(1189) Locus Locus -10-9-8-7-6-5-4-3-2-112345678910 -10-9-8-7-6-5-4-3-2-112345678910 ATTGAKAH ATTGAKAH Position Position Arabidopsis AxSRP 3’UTR 80(1189) Locus A B -10-9-8-7-6-5-4-3-2-112345678910 ATTGAKAH Position Arabidopsis ein5 3’UTR 178(1189) Locus Locus -10-9-8-7-6-5-4-3-2-112345678910 ATTGAKAH C D Position -10-9-8-7-6-5-4-3-2-112345678910 ATTGAKAH Position Arabidopsis TWF 3’UTR 385(1189) Arabidopsis Col-0 3’UTR 112(1189) Locus Locus -10-9-8-7-6-5-4-3-2-112345678910 -10-9-8-7-6-5-4-3-2-112345678910 E F ATTGAKAH ATTGAKAH Position Position Arabidopsis Tx4F 3’UTR 313(1189) G Figure S6. Distribution of uncapped 5′-ends surrounding a shuffled PUF motif for Arabidopsis degradome libraries Distribution of normalized reads around a shuffled PUF motif (ATTGAKAH) in the 3′ UTR of Arabidopsis genes for seven libraries. The shuffled motif was boxed with the first nucleotide set to 1. Loci containing the shuffled motif were identified from the 3′ UTR of all annotated genes and the number is shown in parenthesis above the heat map. Only loci with a total read number greater than five in the 20-nt region are shown and the number of loci in each heat map is also indicated above the heat map. Loci were clustered based on the distribution of normalized read numbers across the 20-nt region by Ward’s method.
A B C D Figure S7. Distribution of uncapped 5′-ends surrounding a shuffled PUF motif for rice degradome libraries Distribution of normalized reads around a shuffled PUF motif (ATTGAKAH) in the 3′ UTR of rice genes for four PARE libraries. The shuffled motif was boxed with the first nucleotide set to 1. Loci containing the shuffled motif were identified from the 3′ UTR of all annotated genes and the number is shown in parenthesis above the heat map. Only loci with a total read number greater than five in the 20-nt region are shown and the number of loci in each heat map is also indicated above the heat map. Loci were clustered based on the distribution of normalized read numbers across the 20-nt region by Ward’s method. Rice INF939 3’UTR 220(1962) Rice NPBs 3’UTR 763(1962) Rice INF9311a 3’UTR 341(1962) Locus Locus Locus -10-9-8-7-6-5-4-3-2-112345678910 -10-9-8-7-6-5-4-3-2-112345678910 ATTGAKAH ATTGAKAH Position Position -10-9-8-7-6-5-4-3-2-112345678910 ATTGAKAH Position Rice SC938 3’UTR 190(1982) Locus -10-9-8-7-6-5-4-3-2-112345678910 ATTGAKAH Position
Arabidopsis Tx4F 3’UTR 1621(6799) Arabidopsis TWF 3’UTR 2384(6799) Locus Locus -10-9-8-7-6-5-4-3-2-112345678910 -10-9-8-7-6-5-4-3-2-112345678910 AATAAA AATAAA Position Position A B C D E F Figure S8. Position-specific enrichment of uncapped 5′-ends surrounding a poly(A) signal-like element across PARE libraries and species Distribution of normalized reads around AATAAA in the 3′ UTR of Arabidopsis and rice genes for two Arabidopsis PARE libraries (A-B) and four rice PARE libraries (C-F). The motif was boxed with the first nucleotide set to 1. Loci containing the motif were identified from the 3′ UTR of all annotated genes and the number is shown in parenthesis above the heat map. Only loci with a total read number greater than five in the 20-nt region are shown and the number of loci in each heat map is also indicated above the heat map. Loci were clustered based on the distribution of normalized read numbers across the 20-nt region by Ward’s method. Rice INF9311a 3’UTR 1754(8084) Locus -10-9-8-7-6-5-4-3-2-112345678910 AATAAA Position Rice INF939 3’UTR 1546(8084) Rice NPBs 3’UTR 3358(8084) Locus Locus -10-9-8-7-6-5-4-3-2-112345678910 -10-9-8-7-6-5-4-3-2-112345678910 AATAAA AATAAA Position Position Rice SC938 3’UTR 962(8084) Locus -10-9-8-7-6-5-4-3-2-112345678910 AATAAA Position
A B Arabidopsis Tx4F 3’UTR 6802(26026) Arabidopsis TWF 3’UTR 7979(26026) Locus Locus -10-9-8-7-6-5-4-3-2-112345678910 ACHTT -10-9-8-7-6-5-4-3-2-112345678910 ACHTT Position Rice SC938 3’UTR 4282(43526) C D Position Locus -10-9-8-7-6-5-4-3-2-112345678910 ACHTT Position E F Figure S9. Position-specific enrichment of uncapped 5′-ends surrounding a ACHTT motif across PARE libraries and species Distribution of normalized reads around a ACHTT motif recognized by Physcomitrella patens Phpat.016G078400 (Pp_0206) in the 3′ UTR of Arabidopsis and rice genes for two Arabidopsis PARE libraries (A-B) and four rice PARE libraries (C-F). The motif was boxed with the first nucleotide set to 1. Loci containing the motif were identified from the 3′ UTR of all annotated genes and the number is shown in parenthesis above the heat map. Only loci with a total read number greater than five in the 20-nt region are shown and the number of loci in each heat map is also indicated above the heat map. Loci were clustered based on the distribution of normalized read numbers across the 20-nt region by Ward’s method. Rice INF9311a 3’UTR 7842(43526) Locus -10-9-8-7-6-5-4-3-2-112345678910 ACHTT Position RiceINF939 3’UTR 4968(43526) Rice NPBs 3’UTR 17320(43526) Locus Locus -10-9-8-7-6-5-4-3-2-112345678910 -10-9-8-7-6-5-4-3-2-112345678910 ACHTT ACHTT Position Position
A B Arabidopsis TWF 3’UTR 7006(21899) Locus Arabidopsis Tx4F 3’UTR 6523(21899) Rice NPBs 3’UTR 25335(62235) -10-9-8-7-6-5-4-3-2-112345678910 C D TGGA Position Locus Locus -10-9-8-7-6-5-4-3-2-112345678910 -10-9-8-7-6-5-4-3-2-112345678910 TGGA TGGA Position Position E F Figure S10. Position-specific enrichment of uncapped 5′-ends surrounding a TGGA motif across PARE libraries and species Distribution of normalized reads around a TGGA motif recognized by Physcomitrella patens Phpat.012G050300 (Pp_0237) in the 3′ UTR of Arabidopsis and rice genes for two Arabidopsis PARE libraries (A-B) and four rice PARE libraries (C-F). The motif was boxed with the first nucleotide set to 1. Loci containing the motif were identified from the 3′ UTR of all annotated genes and the number is shown in parenthesis above the heat map. Only loci with a total read number greater than five in the 20-nt region are shown and the number of loci in each heat map is also indicated above the heat map. Loci were clustered based on the distribution of normalized read numbers across the 20-nt region by Ward’s method. Rice INF9311a 3’UTR 11204(62235) Locus -10-9-8-7-6-5-4-3-2-112345678910 TGGA Position Rice INF939 3’UTR 7508(62235) Locus -10-9-8-7-6-5-4-3-2-112345678910 TGGA Position Rice SC938 3’UTR 5772(62235) Locus -10-9-8-7-6-5-4-3-2-112345678910 TGGA Position
A Arabidopsis TWF 3’UTR 1903(5447) B Arabidopsis Tx4F 3’UTR 1661(5447) Locus Locus -10-9-8-7-6-5-4-3-2-112345678910 -10-9-8-7-6-5-4-3-2-112345678910 GAACA GAACA Position Position C Rice INF9311a 3’UTR 2439(13522) D Rice INF939 3’UTR 1956(13522) Locus Locus -10-9-8-7-6-5-4-3-2-112345678910 -10-9-8-7-6-5-4-3-2-112345678910 GAACA GAACA Position Position E Rice NPBs 3’UTR 5853(13522) F Rice SC938 3’UTR 1471(13522) Locus Locus -10-9-8-7-6-5-4-3-2-112345678910 -10-9-8-7-6-5-4-3-2-112345678910 GAACA GAACA Position Position Figure S11. Position-specific enrichment of uncapped 5′-ends surrounding a GAACA motif across PARE libraries and species Distribution of normalized reads around a GAACA motif recognized by Ostreococcustauri Ot09g01160 (Ot_0263) in the 3′ UTR of Arabidopsis and rice genes for two Arabidopsis PARE libraries (A-B) and four rice PARE libraries (C-F). The motif was boxed with the first nucleotide set to 1. Loci containing the motif were identified from the 3′ UTR of all annotated genes and the number is shown in parenthesis above the heat map. Only loci with a total read number greater than five in the 20-nt region are shown and the number of loci in each heat map is also indicated above the heat map. Loci were clustered based on the distribution of normalized read numbers across the 20-nt region by Ward’s method.
A B Arabidopsis Tx4F 3’UTR 766(2116) Arabidopsis TWF 3’UTR 738(2116) Locus Locus -10-9-8-7-6-5-4-3-2-112345678910 C D CAGAC Position -10-9-8-7-6-5-4-3-2-112345678910 CAGAC Position E F Figure S12. Position-specific enrichment of uncapped 5′-ends surrounding a CAGAC motif across PARE libraries and species Distribution of normalized reads around a CAGAC motif in the 3′ UTR of Arabidopsis and rice genes for two Arabidopsis PARE libraries (A-B) and four rice PARE libraries (C-F). The motif was boxed with the first nucleotide set to 1. Loci containing the motif were identified from the 3′ UTR of all annotated genes and the number is shown in parenthesis above the heat map. Only loci with a total read number greater than five in the 20-nt region are shown and the number of loci in each heat map is also indicated above the heat map. Loci were clustered based on the distribution of normalized read numbers across the 20-nt region by Ward’s method. Rice INF9311a 3’UTR 1026(5907) Locus -10-9-8-7-6-5-4-3-2-112345678910 CAGAC Position Rice INF939 3’UTR 707(5907) Rice NPBs 3’UTR 2797(5907) Locus Locus -10-9-8-7-6-5-4-3-2-112345678910 -10-9-8-7-6-5-4-3-2-112345678910 CAGAC CAGAC Position Position Rice SC938 3’UTR 540(5907) Locus -10-9-8-7-6-5-4-3-2-112345678910 CAGAC Position