Download
1 / 38
390 likes | 563 Vues
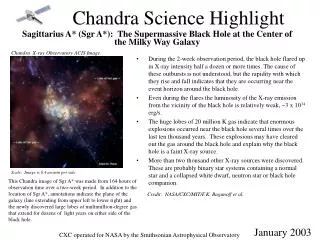
Dinnertime for Sgr A* (The Black Hole in the Center of Our Galaxy). b y James Moran Harvard-Smithsonian Center for Astrophysics. University of Barcelona , October 5, 2012. Summary of Talk.

E N D
Dinnertime for Sgr A*(The Black Hole in the Center of Our Galaxy) by James Moran Harvard-Smithsonian Center for Astrophysics University of Barcelona, October 5, 2012
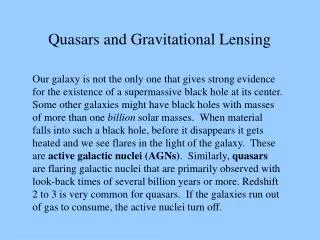
Summary of Talk The mass of the black hole in the Center of the Galaxy (Sgr A*) is about 4 x 10⁶ solar masses. The accretion rate is about 10-8 solar masses per year. The polarization is LCP at all wavelengths from 1 mm to 30 cm. (new) The angular diameter of the radio emission from Sgr A* is about 37 microarcseconds at 1.3 mm wavelength. A object of earth mass is approaching the Galactic Center and could increase the accretion rate significantly starting in mid-2013. (new) VLBI observations of M87 and 1924-293 have also been made at 1.3 mm. (new) Event Horizon Telescope (EHT) under development
SMA in Intermediate Configuration About 0.5arcsecresolution at 1 mm
The Galactic Center on Three Size Scales 1. Circumnuclear (molecular) Disk (CND) and Minispiral (ionized streamers) 120 arcs / 5 pc Zhao, Blundell, Downes, Schuster, Marrone 2. Black hole accretion envelope (100 Rs) 1 mas / 0.3 micro pc Marrone, Munoz, Zhao, Rao 3. SgrA* radio source 37 microarcseconds / 0.01 microparsec Doeleman et al.
Nine Field Mosaic Image of Circumnuclear Disk in Galactic Center CN H2CO SiO SMA Data Sergio Martin Ruiz 3 arcmin field 3 arcs resolution 1.3 mm wavelength
345 GHz 230 GHz Polarization Images at Various Wavelengths from the SMA 690 GHz
2005 SMA Measurements of Faraday Rotation in Sgr A* Important: SLOPE of polarization angle ~ constant in time at 230 GHz
Accretion Rate and Faraday Rotation (,t) =0(t) + 2RM(t) RM = 8.1 x 10⁵ ne B dl × RM = –5.1 x 10⁵ rad/m2 Assumptions equipartition density power law inner radius cutoff of Faraday screen Accretion rate = 10–9–10–7MSun/yr c c
Circular Polarization of Sgr A* Left handed CP at all frequencies measured!! (red) Stokes I (blue) Stokes V Fractional Circular Polarization vs. Frequency
= 1 surface GHz 230 22 1.4 =1 Rs 6 80 1600 =1 (diameter) mas 0.06 0.8 16 BH Faraday Conversion in Sgr A* Range of = 1 surface between 1.4 and 230 GHz: ~350 (based on R =1 ~ -1.1) Faraday conversion phase shift input signal = 109L B43 = /2 (optimum) B = magnetic field in Gauss L = length in pc = wavelength in m mode direction mode direction in ultrarelativistic plasma
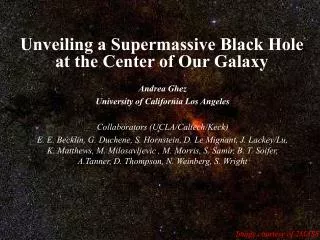
Simulation of the infrared observations of the stars orbiting the Galactic Center by the Genzel Group
What is the Central Mass Around Which These Stars Are Orbiting? T = 15.2 years R = 0.12 arcseconds = 17 light hours M = 4 million x the mass of the Sun Density > 1017 solar masses/pc3
Submm Near IR Radio X-Ray Genzel et al. 2004 IR flare (Hornstein et al. 2007) • Very faint source still detectible at most astronomical observing bands • SED measurements span 10 decades in frequency • LSgrA*~ 300 LSun~ 10–9Eddington limit
Black Hole “image” Dominated by GR • The black hole “shadow” • (Bardeen 1973; Falcke, Agol, Melia 2000; Johannsen and Psaltis 2010) • Measuring the shadow gives Mass. • (Johannsen, Psaltis et al. 2012) Non-spinning BH Rotating accretion envelope Dshadow= sqrt(27) * Rsch Maximally spinning BH Free fall envelope Dshadow= 9/2 * Rsch
Observations of Cygnus A with the Jodrell Bank Intensity Interferometer Square of visibility 125 MHz Jennison and Das Gupta 1952; see also Sullivan 2010
Cygnus A with Cambridge 1-mile Telescope at 1.4 GHz 3 telescopes 20 arcsec resolution Ryle, Elsmore, and Neville, Nature, 205, 1259, 1965
Cygnus A with Cambridge 5 km Interferometer at 5 GHz 16 element E-W Array, 3 arcsecresolution Hargrave and Ryle, MNRAS, 166, 305, 1974
The Synchrotron Emission from Cygnus A Imaged with the VLA at 6 cm Wavelength
1.3 mm Observations of Sgr A* 908km 4030km 4630km VLBI program led by a large consortium led by Shep Doeleman, MIT/Haystack
14 Rsch (140as) Gammie et al. Gaussian and Torus Fit to Visibility Data Doeleman et al. 2008; Fish et al. 2011
Seeing Through the Scattering OBS deviates from scattering for cm INT SCAT for mm INT
Sgr A*’s View of the EHT IRAM GLT - Greenland LMT ALMA SPole SPole
GR Model 7 station 13 station Progression to an Image Doeleman et al., “The Event Horizon Telescope,” Astro2010: The Astronomy and Astrophysics Decadal Survey, Science White Papers, no. 68
Animation of Accretion Object Discovered by Genzel Group, 2012
M87 at 5 GHz (insert) and 43 GHz Right ascension offset (mas) VLBA image at 43 GHz by Hada, et al., Nature, 2011
VLBA Movie of M87 at 43 GHz (7 mm)(Craig Walker et al. 2008) 6.6 x 10⁹Solar Mass BH at 16 Mpc Beam: 0.43x0.21 mas 0.2mas = 0.016pc = 60Rs 1mas/yr = 0.25c
M87 Fringe Visibility Doeleman et al., Science (Express), Sept 25, 2012
1924-292 uv Coverage of VLBI Experiment at 230 GHz, April 2009 Ru-Sen Lu et al., ApJ, 2012, in press
1924-292 uv Plane Data Correlated Flux Density vs. Time Correlated Flux Density vs. uv Distance
Images of 1924-292 5 GHz 43 GHz 230 GHz 50 pc 5 pc 1 pc Shen et al. 1997, 2002 Ru-Sen Lu et al. 2012
Summary • 1.3mm VLBI confirms Rsch scale structure in M87 and Sgr A*. • International collaboration forming strong EHT organization. • Key technical advances under way and roadmap to full EHT by 2015 clear. • Most effort low risk: greatest risk is funding. • EHT is opening a new window on BH study. • GLT is key new element to the EHT.