Download
1 / 17
170 likes | 329 Vues
The Farm Security and Rural Investment Act of 2002. General Overview Crop Program Changes Dairy Provisions. Key Features. Higher loan rates for most crops. Direct payments for wheat, feed grains, cotton, and rice (previously called production flexibility contract payments).

E N D
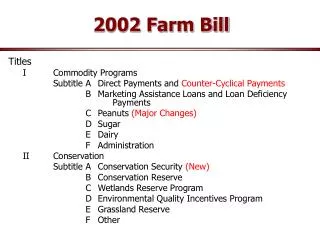
The Farm Security and Rural Investment Act of 2002 • General Overview • Crop Program Changes • Dairy Provisions
Key Features • Higher loan rates for most crops. • Direct payments for wheat, feed grains, cotton, and rice (previously called production flexibility contract payments). • Expanded eligibility for direct payments to producers of oilseeds and peanuts.
Key Features (Continued) • Additional payments (called counter-cyclical payments) to farmers when commodity prices fall below their target prices. • An option for producers to update the bases and yields used to calculate counter-cyclical payments. • New programs for dairy, pulse crops (dry peas, lentils, and chickpeas), peanuts, honey, wool, and mohair.
Key Features (Continued) • Reauthorizing the Conservation Reserve Program and expanding the acreage cap from 36.4 million acres to 39.2 million acres. • Reauthorizing the Environmental Quality Incentives Program and increasing the funding from about $200 million per year to $400 million this year, ranging to $1.3 billion in fiscal year 2007 • Authorizing other new Environmental programs
Fixed Payments • Not tied to current production • Paid on 85% of base acres, but base acres can be updated • Paid on program yields used for FAIR Act payments—no updates • Soybean payment yield: 78% of 1998-2001 yield
Target Prices • Used to determine counter-cyclical payments (CCPs) • CCP rate = Target Price – Fixed Payment – (higher of loan rate or season avg. farm price) • Paid on 85% of base acres • If producers do a full base update, then CCPs paid on updated program yield
Expected CCP for Corn - 2002 Target Price $2.60 Less Fixed Payment $0.26 Less Loan Rate $1.98 Equals CCP per Bushel $0.36 PLUS LDP IF MARKET PRICE IS LESS THAN LOAN RATE. GUARANTEES $2.60/BU. ON 85% OF BASE ACRES @ PROGRAM YIELD
EQIP Features • Funding increased from $1.3 billion over 6 years to $1.3 billion annually by 2007. • Allocation to livestock increased from 50 percent to 60 percent. • Cost sharing at 75 percent; 90 percent for low-resource and beginning farmers.
EQIP Features (Continued) • Removes animal unit cap for eligibility • CAFOs must have Comprehensive Nutrient Management Plan to be eligible for payments. • Payment cap = $450,000 total for FY 02-07. Up from $10,000 annual and $50,000 total for FY 96-01.
Dairy Title Features • $9.90 support price extended through December 31, 2007. • Dairy CCP program authorized from December 2001 through September 2005. • Continues Dairy Export Incentive and Dairy Indemnity Programs.
Dairy Title Features (Continued) • Continues processor fluid milk promotion program and requires importers to pay an assessment equivalent to $0.15 per hundredweight NDPR checkoff. • Mandates three economic studies. • Authorizes (without appropriations) Johnes research program.
National Dairy Market Loss Payments • Uses $16.94 target price relative to Boston Class I price to set monthly deficiency payments (45 percent of difference). • 2.4 million pound annual payment cap. • No cap on total expenditures. • Retroactive to December 2001.
Estimated Monthly Payment Rates • Rates from December 2001 – July 2002 based on actual Boston Class I prices. • Rates from August – December 2002 based on “Higher of” Class III or Class IV futures prices on June 20, 2002 plus $3.25 Boston Class I differential
Projected Total Payments for 2002* • Based on monthly payment rates from previous slide and Milk per cow @ 55 lbs/day • Larger farms may qualify for larger payments if payment cap is liberally interpreted *January-December 2002 payments plus December 2001 retroactive payment received in 2002
Subjective Assessment • Further separates production decisions from marketplace conditions. • A very inefficient means of promoting rural development • Conformance with GATT? • Costly, but less so when compared with supplemental payments outside of FAIR. • Much more a political product than in the past.