Template Matching
Template Matching. Longin Jan Latecki Temple University CIS 601 Based on a project by Roland Miezianko. Agenda. Template Matching Definition and Method Bi-Level Image Gray-Level Image Matlab Example Gray-Level Template Matching Machine Vision Example. Definition.

Template Matching
E N D
Presentation Transcript
Template Matching Longin Jan Latecki Temple University CIS 601 Based on a project by Roland Miezianko
Agenda • Template Matching • Definition and Method • Bi-Level Image • Gray-Level Image • Matlab Example • Gray-Level Template Matching • Machine Vision Example
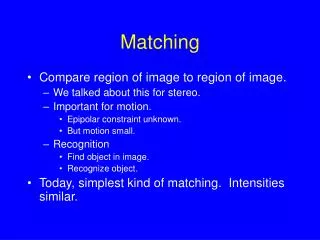
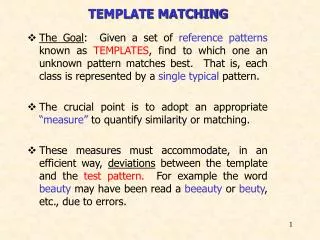
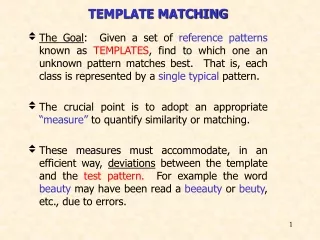
Definition • Technique used in classifying objects. • Template Matching techniques compare portions of images against one another. • Sample image may be used to recognize similar objects in source image.
Definition, cont. • If standard deviation of the template image compared to the source image is small enough, template matching may be used. • Templates are most often used to identify printed characters, numbers, and other small, simple objects.
I(x,y) O(x,y) Correlation x,y x,y Template Image Input Image Output Image Method The matching process moves the template image to all possible positions in a larger source image and computes a numerical index that indicates how well the template matches the image in that position. Match is done on a pixel-by-pixel basis.
Template Source Bi-Level Image TM • Template is a small image, usually a bi-level image. • Find template in source image, with a Yes/No approach.
Template Grey-Level Image TM • When using template-matching scheme on grey-level image it is unreasonable to expect a perfect match of the grey levels. • Instead of yes/no match at each pixel, the difference in level should be used. Source Image
Euclidean Distance Let I be a gray level image and g be a gray-value template of size nm. In this formula (r,c) denotes the top left corner of template g.
Correlation • Correlation is a measure of the degree to which two variables agree, not necessary in actual value but in general behavior. • The two variables are the corresponding pixel values in two images, template and source.
x is the template gray level image x is the average grey level in the template image y is the source image section y is the average grey level in the source image N is the number of pixels in the section image (N= template image size = columns * rows) The value cor is between –1 and +1, with larger values representing a stronger relationship between the two images. Grey-LevelCorrelation Formula
Correlation is Computation Intensive • Template image size: 53 x 48 • Source image size: 177 x 236 • Assumption: template image is inside the source image. • Correlation (search) matrix size: 124 x 188 (177-53 x 236-48) • Computation count 124 x 188 x 53 x 48 = 59,305,728
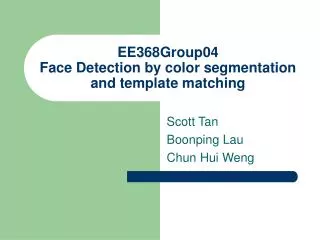
Machine Vision Example • Load printed circuit board into a machine • Teach template image (select and store) • Load printed circuit board • Capture a source image and find template
Machine Vision Example Assumptions and Limitations 1. Template is entirely located in source image 2. Partial template matching was not performed (at boundaries, within image) 3. Rotation and scaling will cause poor matches
Matlab Example Matlab Data Set Template Data Set 1 Data Set 2 Data Set 3 Data Set 4 Data Set 5
Data Set 1 Source Image, Found Rectangle, and Correlation Map Correlation Map with Peak
Data Set 2 Source Image and Found Rectangle Correlation Map with Peak
Data Set 3 Source Image and Found Rectangle Correlation Map with Peak
Data Set 4 Source Image and Found Rectangle Correlation Map with Peak
Data Set 5, Corr. Map Correlation Map with Peak Source Image
Data Set 5, Results Threshold set to 0.800 Threshold set to 0.200