Download
1 / 37
370 likes | 567 Vues
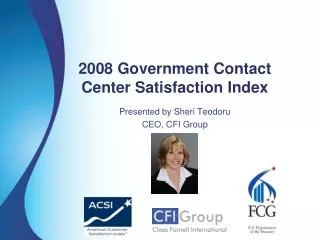
Results of the Q1 2007 American E-Government Satisfaction Index. Results of the Q1 2007 American E-Government Satisfaction Index. Errol Hau Senior Director Government Markets ForeSee Results March 20, 2007. Q1 2007 73.4 Q4 2006 73.9 Q3 2006 73.7 Q2 2006 74.0 Q1 2006 73.5

E N D
Results of the Q1 2007 American E-Government Satisfaction Index Results of the Q1 2007 American E-Government Satisfaction Index • Errol Hau • Senior Director • Government Markets • ForeSee Results • March 20, 2007
Q1 2007 73.4 Q4 2006 73.9 Q3 2006 73.7 Q2 2006 74.0 Q1 2006 73.5 Q4 2005 73.9 Q3 2005 73.5 Q2 2005 72.6 Q1 2005 71.9 Q4 2004 72.1 Q3 2004 71.2 Q2 2004 70.3 Q1 2004 70.7 Q4 2003 69.8 Q3 2003 66.7 Range of scores: 56 to 87 Quarter Year over Year -.1% Quarter to Quarter - .7% 80 Participating Sites ACSI E-Gov Index Trends Trend Scores
First quarterly year over year decline after 9 successive quarters of increases Decrease from Successive Quarter 11 10 9 8 7 6 5 4 3 2 1
How Are We Changing? • Quarter to Quarter Satisfaction Scores • 31% of sites improved (44% last quarter) • 49% of sites declined (24% last quarter) • 20% of sites unchanged • Year over Year Satisfaction Scores • 46% of sites improved (48% last quarter) • 32% of sites declined (31% last quarter) • 22% of sites unchanged • Since Being Measured • 51% of sites improved (38% last quarter) • 40% of sites declined (46% last quarter) • 9% of sites unchanged • Citizens standards keep rising
Distribution of Scores Scores 80s 70s 60s 50s Q1 2007 Satisfaction 16 45 15 4 Q4 2006 Satisfaction 18 50 18 1 Q3 2006 Satisfaction 18 52 22 3 Q2 2006 Satisfaction 20 52 18 2 Q1 2006 Satisfaction 14 57 17 3 Percentages 80s 70s 60s 50s Q1 2007 Satisfaction 20% 56% 19% 5% Q4 2006 Satisfaction 21% 57% 21% 1% Q3 2006 Satisfaction 19% 55% 23% 3% Q2 2006 Satisfaction 22% 56% 20% 2% Q1 2006 Satisfaction 15% 63% 19% 3%
Q1 2007 Successes Score Increase Percent Increase Quarter over Quarter • BEA Main Website +4 6% - IRS Main Website +4 6% - CDC Main Website +4 5% Year over Year • USTTB Main Website +8 +12% • AIDSinfo Website +6 + 8% Since First Measured • GSA Main Website +14 +25% • GobiernoUSA Website +10 +14%
Industry Comparisons • Q1 2007 ACSI E-Government Satisfaction Index73.4 • E-Commerce 74.2 • Information/News 72.8 • Portal/Department Main Website 74.1 • Recruitment/Careers 77.2 • ACSI Government (Dec 2006) 72.3 • ACSI Aggregate Score (Feb. 2007) 74.9 • ACSI E-Commerce (Feb 2007) 80.0 • ACSI E-Business (Aug 2006) 76.5 • ACSI Search (Aug 2006) 79.0 • ACSI News and Information 73.0 • ACSI Portals 76.0 • ForeSee Results Index 71.3 • ForeSee Results e-Gov Index 72.4
Industry Comparisons • Q1 2007 ACSI E-Government Satisfaction Index73.4 • E-Commerce 74.2 • Information/News 72.8 • Portal/Department Main Website 74.1 • Recruitment/Careers 77.2 • ForeSee Results Index 71.3 • ForeSee Results e-Gov Index 72.4 • ForeSee Results B2B 59.6 • ForeSee Results Financial Services 72.7 • ForeSee Results Career Services 73 • ForeSee Results Fortune 500 70.5 • ForeSee Results Fortune 200 70.4 • ForeSee Results Retail 74.8 • ACSI Amazon 87 • ACSI Barnes&Noble 88 • Google 81 • ABCNews.com 73
Future Behavior Benchmarks E-Gov Benchmarks • Satisfaction73.4 • Likelihood to Return to site 83 • Likelihood to Recommend 79 • Likelihood as Primary Resource 75 ForeSee Results Government Wide Benchmarks • Satisfaction 73 - 71 • Likelihood to Return to site 83 - 81 • Likelihood to Recommend 79 - 76 • Likelihood as Primary Resource 75 - 74 ForeSee Results Benchmarks • Satisfaction 72 - 71 • Likelihood to Return to site 82 - 81 • Likelihood to Recommend 76 - 75 • Likelihood as Primary Resource 74 - 71
The Story Behind The Numbers Element level analysis – Scores • Site Performance 82 • Content 80 • Look and Feel 78 • Functionality 77 • Navigation 73 • Search 74
The Story Behind The Numbers Element-level Analysis Impacts First or Second Priority • Search 82% 80 low to 96 high • Navigation 39% 37 low to 52 high • Functionality 52% 36 low to 51 high • Look and feel 19% 28 low to 37 high • Image 44% 23 low to 60 high • Content 8% 1 low to 7 high • Privacy 0% 0 low to 11 high A zero sum game
The Leaders and BestPortals/Department Main Sites • Range of e-Gov scores 65 to 82 • Yahoo (Aug 2006) 76 • MSN 74 • AOL 74
The Leaders and BestNews/Information Sites • Range of e-Gov scores 59 to 85 • ABCNews.com 73 • MSNBC.com 72 • CNN.com 74 • USAToday.com 74 • NYTimes.com 72
The Leaders and BestE-Commerce/Transaction Sites • Range of e-Gov scores 57 to 86 • B&N.com 88 • Amazon 87 • Ebay 80 • 1-800Flowers.com 77
The Leaders and BestRecruitment/Careers • Range of E-Gov scores 76 to 79
Customer 2.0 Summit Customer 2.0 – A Web Customer-Centricity Summit for Government, Trade Associations and Non-Profits • May 1, 9:00 am – 4:00 pm • George Washington University, Cafritz Conference Center • Attendance is free – register on ForeSee Results website today (www.ForeSeeResults.com) Speakers will include: • Megan Burns, Forrester Research Principal Analyst • Dr. Claes Fornell, Director of the National Quality Research Center, University of Michigan • Lee Rainie, Director of the Pew Internet & American Life Project • Meet SRAs, hear about new product updates • Hear from your peers, including: Alcohol and Tobacco Tax and Trade Bureau, the Social Security Administration, the General Services Administration and Freddie Mac.
For More Information… Errol Hau w.734-205-2552 c. 734-678-3071 Errol.Hau@ForeSeeResults.com