Download
1 / 34
370 likes | 773 Vues
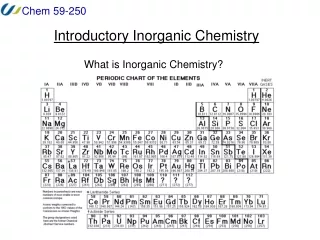
Introductory Inorganic Chemistry. What is Inorganic Chemistry?. As: 1s 2 2s 2 2p 6 3s 2 3p 6 4s 2 3d 10 4p 3. For more information about these periodic tables visit the site where I obtained the pictures: http://chemlab.pc.maricopa.edu/periodic/default.html.

E N D
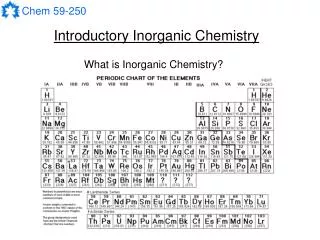
Introductory Inorganic Chemistry What is Inorganic Chemistry?
For more information about these periodic tables visit the site where I obtained the pictures: http://chemlab.pc.maricopa.edu/periodic/default.html
Review of Concepts Thermochemistry: Standard state: 298.15 K, 1 atm, unit concentration Enthalpy Change, DH° DH° = SH°products - SH°reactants Entropy Change, DS° Free Energy Change, DG DG = DH - TDS At STP: DG° = DH° - (298.15 K)DS°
Standard Enthalpy of Formation, DH°f DH° for the formation of a substance from its constituent elements Standard Enthalpy of Fusion, DH°fus Na(s) Na(l) Standard Enthalpy of Vapourization, DH°vap Br2(l) Br2(g) Standard Enthalpy of Sublimation, DH°sub P4(s) P4(g) Standard Enthalpy of Dissociation, DH°d ½ Cl2(g) Cl(g) Standard Enthalpy of Solvation, DH°sol Na+(g) Na+(aq)
Ionization Enthalpy, DH°ie The enthalpy change for ionization by loss of electron(s) Na(g) Na+(g) + e-DH°ie = 502 kJ/mol Al(g) Al+(g) + e-DH°ie = 578 kJ/mol Al+(g) Al2+(g) + e-DH°ie = 1817 kJ/mol Al2+(g) Al3+(g) + e-DH°ie = 2745 kJ/mol Thus: Al(g) Al3+(g) + e-DH°ie = 5140 kJ/mol
Electron Attachment Enthalpy, DH°ea The enthalpy change for the gain of an electron Cl(g)+ e- Cl-(g)DH°ea = -349 kJ/mol O(g)+ e- O-(g)DH°ea = -142 kJ/mol O-(g)+ e- O2-(g)DH°ea = 844 kJ/mol Electron Affinity, EA = -DH°ea + 5/2 RT EA = -DH°ea
Na(s) Na(g) Na+(g) ½ Cl2(g) Cl(g) Cl-(g) DH°sub DH°ie NaCl(s) Lattice Energy, U DH°d DH°ea DH°f Why should we care about these enthalpies? They will provide us information about the strength of bonding in solids.
Bond Energy, EA-B Diatomic: H-Cl(g) H(g) + Cl(g)DH= 431 kJ/mol Polyatomic: H-O-H(g) H(g) + O-H(g)DH= 497 kJ/mol O-H(g) H(g) + O(g) DH= 421 kJ/mol Thus: H-O-H(g) 2 H(g) + O(g)DH= 918 kJ/mol Average O-H bond energy = 918 / 2 EO-H = 459 kJ/mol
H2N-NH2(g) 4 H(g) + 2 N(g) DH= 1724 kJ/mol NH3(g) 3 H(g) + N(g) DH= 1172 kJ/mol Thus average N-H bond energy = 1172 / 3 EN-H = 391 kJ/mol Since 1724 = 4 EN-H + EN-N We can estimate N-N bond energy to be: 1724 – 4(391) = 160 kJ/mol
EH-H = 436 kJ/mol EC=O = 745 kJ/mol EC-H = 414 kJ/mol EC-O = 351 kJ/mol EO-H = 464 kJ/mol DHrxn= SE(bonds broken) – SE(bonds formed) DHrxn= (436 + 745) – (414 + 351+ 464) kJ/mol DHrxn= -48 kJ/mol
Remember that such calculated bond energies can change For H2N-NH2(g): EN-N = 160 kJ/mol For F2N-NF2(g): EN-N = 88 kJ/mol For O2N-NO2(g): EN-N = 57 kJ/mol They are only a rough approximation and predictions must be made cautiously.
Free Energy Change, DG = DH - TDS At STP: DG° = DH° - (298.15 K) DS° The two factors that determine if a reaction is favourable: If it gives off energy (exothermic) DH= SHproducts - SHreactants DH < 0 If the system becomes “more disordered” DS= SSproducts - SSreactants DS > 0 If DG < 0, then reaction is thermodynamically favourable
aA + bB + cC + … hH + iI + jJ + … DG lets us predict where an equilibrium will lie through the relationship: DG = -RT ln K So if DG < 0, then K > 1 and equilibrium lies to the right. There are three possible ways that this can happen with respect to DH and DS.
If both enthalpy and entropy favour the reaction: i.e. DH < 0 and DS > 0 then DG < 0. S(s) + O2(g) SO2(g)DH° = -292.9 kJ/mol TDS° = 7.5 kJ/mol DG° = -300.4 kJ/mol If enthalpy drives the reaction: i.e. DH < 0 and DS < 0, but |DH| > |TDS|, then DG < 0. N2(g) + 3 H2(g) 2 NH3(g)DH° = -46.2 kJ/mol TDS° = -29.5 kJ/mol DG° = -16.7 kJ/mol If entropy drives the reaction: i.e. DH > 0 and DS > 0, but |DH| < |TDS|, then DG < 0. NaCl(s) Na+(aq) + Cl-(aq)DH° = 1.9 kJ/mol TDS° = 4.6 kJ/mol DG° = -2.7 kJ/mol
How do people obtain these values? Measure change in equilibrium constants with temperature to get DH° using the relationship: Measure the equilibrium constant for the equilibrium, then determine DG° using the relationship ? : DG° = -RT ln K Often not that easy…
Reduction-Oxidation (RedOx) reactions: Reduction – gain of electrons Oxidation – loss of electrons DE°, the standard potential for an equilibrium, gives access to DG° through the following relationship: DG° = - nFDE° where, n = number of electrons involved F = Faraday’s constant = 96.4867 kJ mol-1 V-1 (e-)-1 Note: if DG° < 0, then must be DE° > 0 So favourable reactions must have DE° > 0
Half-Cell Reduction Potentials Al3+(aq) + 3 e- Al(s)DE° = -1.67 V Sn4+(aq) + 2 e- Sn2+(aq)DE° = 0.15 V thus for: 2 Al(s) + 3 Sn4+(aq) 2 Al3+(aq) + 3 Sn2+(aq) DE° = -(-1.67 V) + (0.15 V) = 1.82 V for 6 electrons So: DG° = - nFDE° = - (6 e-)F (1.82 V) = -1054 kJ/mol
Oxidation state diagrams (Frost Diagrams) Relative Energy vs. Oxidation State (under certain conditions) • Provides: • - Relative stability of • oxidation states • Energies available or • required for RedOx reactions • (the slope between reactant • and product)
Oxidation state diagrams (Frost Diagrams) Some important information provided by Frost diagrams:
The most useful aspect of Frost diagrams is that they allow us to predict whether a RedOx reaction will occur for a given pair of reagents and what the outcome of the reaction will be. This is described in the handout. Oxidation state diagrams (Frost Diagrams) The diagram for Mn displays many of these features.