Some Distributed Coordination Schemes for Wireless Sensor Networks
360 likes | 498 Vues
Some Distributed Coordination Schemes for Wireless Sensor Networks. Deborah Estrin UCLA Computer Science Department and USC/ISI http://lecs.cs.ucla.edu/estrin destrin@cs.ucla.edu

Some Distributed Coordination Schemes for Wireless Sensor Networks
E N D
Presentation Transcript
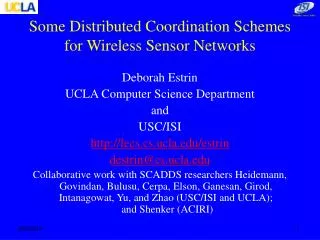
Some Distributed Coordination Schemes for Wireless Sensor Networks Deborah Estrin UCLA Computer Science Department and USC/ISI http://lecs.cs.ucla.edu/estrin destrin@cs.ucla.edu Collaborative work with SCADDS researchers Heidemann, Govindan, Bulusu, Cerpa, Elson, Ganesan, Girod, Intanagowat, Yu, and Zhao (USC/ISI and UCLA); and Shenker (ACIRI)
Disaster Response Circulatory Net I. Motivation Embed numerous distributed devices to monitor and interact with physical world: work-spaces, hospitals, homes, vehicles, and “the environment” Network these devices so that they can coordinate to perform higher-level tasks. Requires robust distributed systemsof hundreds or thousands of devices.
Laboratory Environmental Monitoring Bio-Tank Sensors -scaled Tethered Robot Algae Inner wall of storm drain 2 meters Sensors Complex Structures Model Development Motivating Applications
Theme: New Constraints • Tight coupling to the physical world • Need better physical models • More experimentation • Designing for energy constraints • Coping with “apparent” loss of layering
Theme: New Design Goals • Designing for long-lived (and often energy-constrained) systems • Exploiting redundancy • Low-duty cycle operation • Tiered architectures • Self configuring systems • Measure and adapt to unpredictable environment • Exploit spatial diversity of sensor/actuator nodes • Localization and Time synchronization are key building blocks
Implications for Wireless Sensor Network Design • Achieve desired global behavior through localized interactions, without global state • Avoid communication over long distances [Pottie 2000] • Energy propagation loss: E α R4 (10 m: 5000 ops/transmitted bit; 100 m: 50,000,000 ops/transmitted bit) • Empirically adapt to observed environment • Dynamic, messy, environments preclude pre-configured behavior • Leverage data processing/aggregation inside the network
Roadmap • Motivation • Directed Diffusion • Other enabling schemes: time synch, localization, self configuration • Wrap up: tiered architecture, future work
II. Example: Directed Diffusion • In-network data processing (e.g., aggregation, caching) • Application-aware communication primitives • expressed in terms of named data (not in terms of the nodes generating or requesting data) • Distributed algorithms using localized interactions and measurement based adaptation
Basic Directed Diffusion Setting up gradients Source Sink Interest = Interrogation in terms of data attributes Gradient = direction and strength
Basic Directed Diffusion Sending data and Reinforcing the “best” path Source Sink Low rate event Reinforcement = Increased interest
Directed Diffusion and Dynamics Source Sink Recovering from node failure Low rate event Reinforcement High rate event
Directed Diffusion and Dynamics Source Sink Stable path Low rate event High rate event
For propagating interests In our example, flood More sophisticated behaviors possible: e.g. based on cached information, GPS For data transmission Multi-path delivery with selective quality along different paths probabilistic forwarding single-path delivery, etc. Local Behavior Choices • For setting up gradients • data-rate gradients are set up towards neighbors who send an interest. • Others possible: probabilistic gradients, energy gradients, etc. • For reinforcement • reinforce paths, or parts thereof, based on observed delays, losses, variances etc. • other variants: inhibit certain paths because resource levels are low
Initial simulation study of diffusion • Key metric • Average Dissipated Energy per event delivered • indicates energy efficiency and network lifetime • Compare diffusionto • flooding • centrally computed tree (omniscient multicast)
Diffusion Simulation Details • Simulator: ns-2 • Network Size: 50-250 Nodes • Transmission Range: 40m • Constant Density: 1.95x10⁻³ nodes/m2 (9.8 nodes in radius) • MAC: Modified Contention-based MAC • Energy Model: Mimic a realistic sensor radio [Pottie 2000] • 660 mW in transmission, 395 mW in reception, and 35 mw in idle
Diffusion Simulation • Surveillance application • 5 sources are randomly selected within a 70m x 70m corner in the field • 5 sinks are randomly selected across the field • High data rate is 2 events/sec • Low data rate is 0.02 events/sec • Event size: 64 bytes • Interest size: 36 bytes • All sources send the same location estimate for base experiments
Average Dissipated Energy (Standard 802.11 energy model) 0.14 Diffusion 0.12 Flooding Omniscient Multicast 0.1 0.08 Average Dissipated Energy (Joules/Node/Received Event) 0.06 0.04 0.02 0 0 50 100 150 200 250 300 Network Size • Standard 802.11 is dominated by idle energy
Average Dissipated Energy (Sensor radio energy model) 0.018 0.016 Flooding 0.014 0.012 0.01 0.008 Omniscient Multicast (Joules/Node/Received Event) Average Dissipated Energy 0.006 Diffusion 0.004 0.002 0 0 50 100 150 200 250 300 Network Size Diffusion can outperform flooding and even omniscient multicast. WHY ?
Impact ofIn-network Processing 0.025 Diffusion Without Suppression 0.02 0.015 (Joules/Node/Received Event) Average Dissipated Energy 0.01 Diffusion With Suppression 0.005 0 0 50 100 150 200 250 300 Network Size Application-level suppression allows diffusion to reduce traffic and to surpass omniscient multicast.
Impact of Negative Reinforcement 0.012 0.01 Diffusion Without Negative Reinforcement 0.008 Average Dissipated Energy (Joules/Node/Received Event) 0.006 0.004 Diffusion With Negative Reinforcement 0.002 0 0 50 100 150 200 250 300 Network Size Reducing high-rate paths in steady state is critical
Summary of Diffusion Results • Under the investigated scenarios, diffusion outperformed omniscient multicast and flooding • Application-level data dissemination has the potential to improve energy efficiency significantly • Duplicate suppression is only one simple example out of many possible ways. • Aggregation (in progress) • All layers have to be carefully designed • Not only network layer but also MAC and application level • Experimentation on our testbed in progress
Implied direction: hierarchical queries • Create processing points in the network • High level interests/queries for activity triggers lower level local queries for particular data modalities and signatures (e.g. acoustic and vibration patterns that are mapped to the activity of interest) • As opposed to generating detailed queries at sink points and relying on opportunistic aggregation alone. Acoustic? Source Large animal? Sink
Ongoing work in Diffusion • Multipath: reinforcing multiple upstream neighbors for load balancing and robustness • Braided vs. Disjoint paths • Opportunistic aggregation of source data • Managing gradients/resources • Tiny diffusion for Motes • Diffusion under mobility: objects, nodes
III. Enabling Sensor Networks:works in progress • Time synchronization • Localization • Self-configuration
Time Synchronization • Critical at many layers • TDMA guard bands • Data aggregation, collaborative processing • Localization • But time sync needs are non-uniform • Precision • Lifetime • Scope & Availability • Cost and form factor • And time sync can be expensive in terms of communications…energy • No single method optimal on all axes
Pulse Synchronization • “External” node generates pulse. Synchronizing nodes compare reception times. • Create locality of synchronized nodes, quickly and energy-efficiently • NTP good at correcting frequency • Local pulse good at correcting phase • Use combination • Initial experiment using wired stimulus sent to 10 nodes…evaluated precision of achievable timestamp • 1 usec clock resolution achieved (vs 100 usec with NTP alone) • Combination is 10x better than either solution alone: multimodal is good • Do as well when NTP used in pre-training!
Localization • Needed for coordination of many 3-space related tasks • Coordination/scoping of network operation as well • Multi-modal ranging and localization: • RF RSSI: inadequate for most environments due to multi-path, shadowing • Acoustic ranging: measure time of flight of chirp, using RF for synchronization • Non Line of Site propagation effects distort measurements • Hard to determine source of geometrical inconsistencies • Investigating imaging to identify NLOS sources and combine with acoustic
Results This graph shows the results of a series of tests in a noisy machine room. Each point represents about 10 trials. The tests were conducted at 1 m intervals. The data in each point ranges about 1.5 cm. The variance is about 0.01 cm
Self-configuration • Each node assesses its connectivity and signals or actuates when it detects a depleted (BW/fidelity) region. • 'Healing' is collaborative self-organized deployment of nodes • Activate more/fewer nodes • Mobilize more/fewer nodes • Adjust duty cycle/power level of existing nodes… • Assumptions: • No centralized processing; all nodes act based on locally available information. • A very large solution space; not seeking unique optimal solution. • Some links have high packet loss..
IV. Wrapping up…Tiered Architecture • We are implementing a sensor net hierarchy: PC-104s, tags, motes, ephemeral one-shot sensors • Save energy by • Running the lower power and more numerous nodes at higher duty cycles than larger ones • Having low-power “pre-processors” activate higher power nodes or components (Sensoria approach) • Components within a node can be tiered too • Our “tags” are a stack of loosely coupled boards • Interrupts active high-energy assets only on demand
Embedded PC: COTS PC104 CPU module AMD ELANSC400, 16MB RAM+16MB FlashDisk, 4 serial/1 parallel ports Phasing out current radio: 418Mhz RPC from Radiometrix Moving to RFM OS: Slimmed Redhat 6.1. (2.2.x/Libc6) Incoporating PC104+ for higher end processing, image capture, etc Tags and Motes: 8 bit proc (ATMEL/PIC) RFM Radio Mote nicely packaged Tag for more experimentation Culler’s TOS Tiered Platform for experimentation with SCADDS algorithms ISI PC-104 UCB Mote (Pister) UCLA Tag (Girod)
Technical challenges • Ad hoc, self organizing, adaptive systems with predictable behavior • Collaborative processing, data fusion, multiple sensory modalities • Data analysis/mining to identify collaborative sensing, triggering thresholds, etc • Combining experimentation, simulation, and analysis • Engaging theory community (Algorithms? Controls?)
Enormous Potential Impact Disaster Recovery and Urban Rescue Earth Science Exploration Condition Based Maintenance Wearable computing Medical monitoring Networked Embedded Systems Smart spaces Transportation EnvironmentalMonitoring Active Structures Biological Monitoring Bio-Tank Strand Stand -scaled Tethered Robot Algae Sensors 2 meters
More information • UCLA Laboratory for Embedded Collaborative Systems (LECS) • http://lecs.cs.ucla.edu • UCLA Distributed Embedded Systems Program (DESP) • http://desp.cs.ucla.edu (joint EE and CS) • SCADDS project • http://www.isi.edu/scadds • ns-2: network simulator (with diffusion supports) • http://www.isi.edu/nsnam/dist/ns-src-snapshot.tar.gz • Our testbed and software • http://www.isi.edu/scadds/testbeds.html
Sensor networks www.isi.edu/scadds www.janet.ucla.edu/WINS wins.rsc.rockwell.com wind.lcs.mit.edu/~hari www.nesl.ee.ucla.edu/people/mbs tinyos.millennium.berkeley.edu Smart Matter www.parc.xerox.com/spl/projects/smart-matter www-swiss.ai.mit.edu/projects/amorphous Internet design inspiration irl.cs.ucla.edu/AWC/ www-mash.cs.berkeley.edu/mash Some Other Related Work(NOT complete)