Download
1 / 16
160 likes | 282 Vues
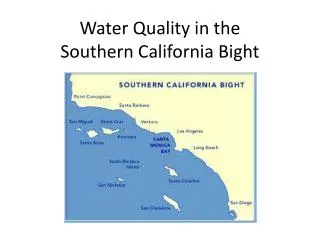
Coastal Environmental Quality Initiative 2007-2008. Coastal Connectivity in the Southern California Bight. Dave Siegel, James Watson, Satoshi Mitarai, (UCSB) Charles Dong & Jim McWilliams (UCLA). Goal of This Study. Assess coastal connectivity via advection of water parcels in SoCal Bight

E N D
Coastal Environmental Quality Initiative 2007-2008 Coastal Connectivity in the Southern California Bight • Dave Siegel, James Watson, Satoshi Mitarai, • (UCSB) • Charles Dong & Jim McWilliams • (UCLA)
Goal of This Study • Assess coastal connectivity via advection of water parcels in SoCal Bight • Help MPA design (e.g., Chris’s work) • Approach: implement offline particle tracking in Charles’ flow simulations
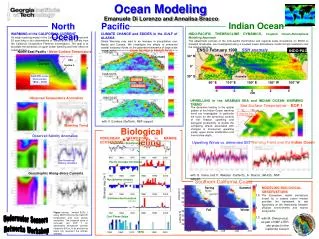
Charles’ ROMS Simulations Simulated wind field Simulated flow fields (surface vorticity normailized by f) Wind forcing Dong and McWilliams (2007) Forced by “realistic” wind Conil & Hall (2006)
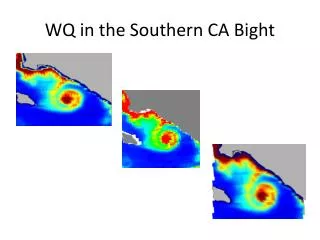
Flow Circulation in SoCal Bight A Big Upllwelling shadow 6 synoptic views of circulation in SBC
Offline Particle Tracking Nearshore habitat range • Nearshore habitat = 100 m or shallower • Lagrangian particles are released & settle within habitats • Settlement = particles within nearshore habitat during competency time window 100-m isobath
Where do they go?(From North Shore of SBC Islands) Single day release in Summer Single day release in Winter Day 0 = 7/1/02 Day 0 =1/1/02 Red dots = settling particles (competency = 20 - 40 d) • Nowhere (few settlements) • Natal areas (self settlement)
Where do they go?(From Palos Verdes Peninsula) Summer Winter Day 0 = 7/1/02 Day 0 =1/1/02 Red dots = settling particles (competency = 20 - 40 d) • “Everywhere” • North of PV / SBC
Where do they go?(From San Niclolas Islands) Summer Winter Day 0 = 7/1/02 Day 0 =1/1/02 Red dots = settling particles (competency = 20 - 40 d) • Few settlements • Mainland / SBC Islands
Where do they come from?(To North Shore of SBC Islands) Summer Winter Day 0 = 7/1/02 Day 0 =1/1/02 Red dots = settling particles (competency = 20 - 40 d) • Mostly from Ventura / LA • From “everywhere”
Where do they come from?(To Palos Verdes Peninsula) Summer Winter Day 0 = 7/1/02 Day 0 =1/1/02 Red dots = settling particles (competency = 20 - 40 d) • From natal areas • South of PV / San Nicholas
Where do they come from?(To San Nicholas Islands) Summer Winter Day 0 = 7/1/02 Day 0 =1/1/02 Red dots = settling particles (competency = 20 - 40 d) • PV / natal areas (few) • PV / SBC (few)
Role of Chaotic Eddying Motions(From San Nicholas Island) Summer Winter Day 0 = Jan. 1, 2002 Day 0 = Jan. 15, 2002 Red dots = settling particles (competency = 20 - 40 d) • From “everywhere” • Palos Verdes / Natal
Rolf of Vertical Positioning(From Palos Verdes) Passive vertical transport DVM (20 m) Day 0 = July 1, 2002 Day 0 = Jan. 1, 2002 Red dots = settling particles (competency = 20 - 40 d) • More spread • More clustering
And more... • Inter-annual variability • Climate variability (e.g., ENSO) • Eileen brought 1997 & 1998 flow simulations
Short-term Goal • Write up a physical oceanographic two papers describing dispersal patterns in SCB • By January • James talk more about connectivity