Download
1 / 1
10 likes | 145 Vues
Indoor Air Quality: Carbon Monoxide. Chebatoris, A.W., Harvey, J.W., Hess, B.T., Krepps, J.P., O’Brien, K.A., Short, D.B., and Spaulding, R.E. Abstract

E N D
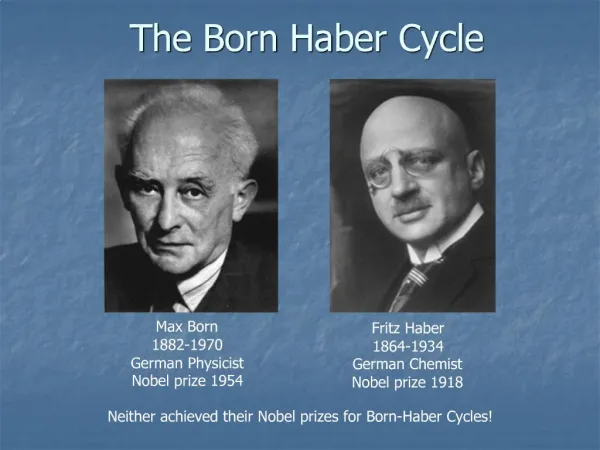
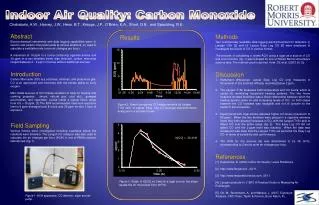
Indoor Air Quality: Carbon Monoxide Chebatoris, A.W., Harvey, J.W., Hess, B.T., Krepps, J.P., O’Brien, K.A., Short, D.B., and Spaulding, R.E. Abstract Electrochemical instruments with data logging capabilities were: (i) used to test carbon monoxide levels at various locations, (ii) used to calculate a ventilation rate (room air changes per hour). A maximum of 14 ppm in a home containing cigarette smoke and 10 ppm in a non smokers home was detected, carbon monoxide ranged between 0 - 6 ppm in homes without additional sources. Introduction Carbon Monoxide (CO) is a colorless, odorless, and poisonous gas. CO is an asphyxiant and interferes with the bloods ability to carry oxygen. Man-made sources of CO include oxidation of fuels for heating and cooking purposes (wood, natural gas, coal etc.), garaged automobiles, and cigarettes. Levels inside a typical home range from 0.5 – 15 ppm. [1] The EPA recommended maximum exposure limit is 9 ppm averaged over 8 hours and 35 ppm for any 1 hour of exposure. Field Sampling Various homes were investigated including examples where the residents were smokers. The Langan CO analyzer was also used to calculate the air changes per hour (ACH) in one of RMUs science laboratories (fig. 1). • Methods • Two commercially available data logging electrochemical CO detectors (i) Langan t15n [2] and (ii) Lascar Easy Log CO [3] were employed to investigate the levels of CO in various homes. • The process of calculating a rooms ACH using a cigar as a source of CO and a CO monitor (fig. 1) was followed for one of Robert Morris University’s science labs. The method used is derived from Ottet al. (2007) [4, 5]. • Discussion • Instrument differences: Lascar Easy Log CO only measures in increments of 0.5 and had difficulty recording below 2 ppm. • The Langan T15n measures both temperature and CO levels, which is useful for monitoring household heating systems. The two home locations showed that there was a direct relationship between when the heating system came on and increasing levels of CO. In both cases however the CO increase was negligible and not of concern to the health of the occupants. • Experiments with cigar smoke detected higher CO levels (maximum of 80 ppm). When the two monitors were placed in a cigarette smokers home they both showed increases in CO, with the Langan T15n able to detect CO over the entire range (fig. 2). The Easy Log CO did not detect CO until the 2 ppm level was reached. When the data was reviewed it was clear that the Langan T15n out performs the Easy Log CO in terms of sensitivity and performance. • The ACH for the science lab was determined to be 35 m3/hr, corresponding to 2 whole room air changes per hour. • References • [1] Hess-Kosa, K. (2002) Indoor Air Quality. Lewis Publishers. • [2] http://www.langan.biz , 03/11. • [3] http://www.lascarelectronics.com, 03/11. • [4] Langan products In. (1997) A Practical Guide to Measuring Air Exchanges. • [5] Ott, W., Stenemann, A., and Wallace, L. (2007) Exposure Analysis, CRC Press, Taylor & Francis, Boca Raton, FL. Results Figure 2: Graph comparing CO measurements by Langan T15n (red) to Lascar Easy Log CO (orange) electrochemical analyzers in a smokers home. Figure 3: Graph of ln[CO] vs. time for a cigar source, the slope equals the air moved per hour (m3/hr). Figure 1: ACH apparatus: CO detector, cigar and air pump.