
Uploaded by
armen
2 SLIDES
108 VUES
20LIKES
Student Glasses Data Analysis Chart
DESCRIPTION
Analyzing data on student glasses and club involvement at BMS - calculating fractions, median, range, and mode of height data.
Download
1 / 2
Download Presentation

Télécharger la présentation
Student Glasses Data Analysis Chart
An Image/Link below is provided (as is) to download presentation
Download Policy: Content on the Website is provided to you AS IS for your information and personal use and may not be sold / licensed / shared on other websites without getting consent from its author.
Content is provided to you AS IS for your information and personal use only.
Download presentation by click this link.
While downloading, if for some reason you are not able to download a presentation, the publisher may have deleted the file from their server.
During download, if you can't get a presentation, the file might be deleted by the publisher.
E N D
Presentation Transcript
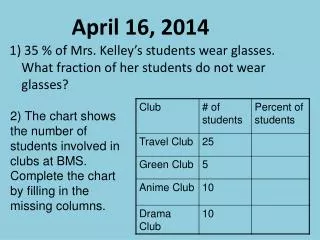
April 16, 2014 1) 35 % of Mrs. Kelley’s students wear glasses. What fraction of her students do not wear glasses? 2) The chart shows the number of students involved in clubs at BMS. Complete the chart by filling in the missing columns.
Heights of Jon’s friends (in inches) April 17, 2014 x x x x x x x x x x 1) How many people are 61” tall? 2) What is the median height? 3) What is the range of the heights? 4) What is the mode of the heights? x x x x x x x 60 62 64 66 68


More Related
Audio
Live Player