Download
1 / 1
10 likes | 157 Vues
Three-dimensional Crystallographic Analysis of the Cathode of a Solid Oxide Fuel Cell Gregory S. Rohrer, Carnegie-Mellon University, DMR 0520425

E N D
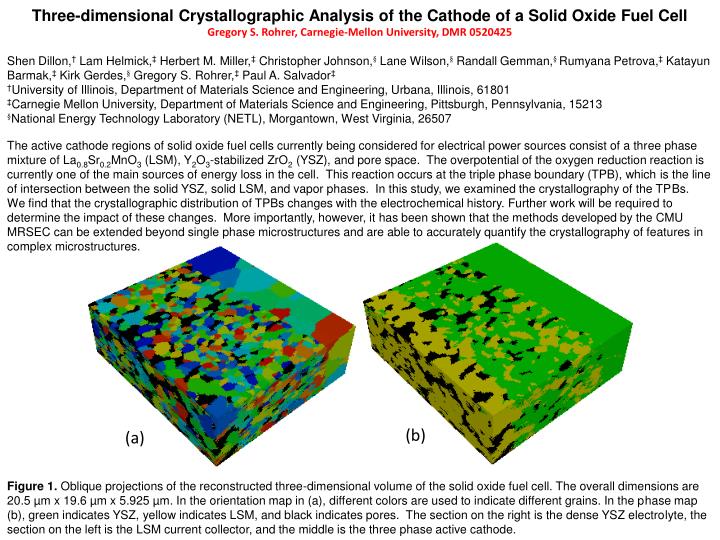
Three-dimensional Crystallographic Analysis of the Cathode of a Solid Oxide Fuel Cell • Gregory S. Rohrer, Carnegie-Mellon University, DMR 0520425 Shen Dillon,† Lam Helmick,‡ Herbert M. Miller,‡ Christopher Johnson,§ Lane Wilson,§ Randall Gemman,§ RumyanaPetrova,‡KatayunBarmak,‡ Kirk Gerdes,§ Gregory S. Rohrer,‡ Paul A. Salvador‡ †University of Illinois, Department of Materials Science and Engineering, Urbana, Illinois, 61801 ‡Carnegie Mellon University, Department of Materials Science and Engineering, Pittsburgh, Pennsylvania, 15213 §National Energy Technology Laboratory (NETL), Morgantown, West Virginia, 26507 • The active cathode regions of solid oxide fuel cells currently being considered for electrical power sources consist of a three phase mixture of La0.8Sr0.2MnO3 (LSM), Y2O3-stabilized ZrO2 (YSZ), and pore space. The overpotential of the oxygen reduction reaction is currently one of the main sources of energy loss in the cell. This reaction occurs at the triple phase boundary (TPB), which is the line of intersection between the solid YSZ, solid LSM, and vapor phases. In this study, we examined the crystallography of the TPBs. We find that the crystallographic distribution of TPBs changes with the electrochemical history. Further work will be required to determine the impact of these changes. More importantly, however, it has been shown that the methods developed by the CMU MRSEC can be extended beyond single phase microstructures and are able to accurately quantify the crystallography of features in complex microstructures. (b) (a) Figure 1.Oblique projections of the reconstructed three-dimensional volume of the solid oxide fuel cell. The overall dimensions are 20.5 µm x 19.6 µm x 5.925 µm. In the orientation map in (a), different colors are used to indicate different grains. In the phase map (b), green indicates YSZ, yellow indicates LSM, and black indicates pores. The section on the right is the dense YSZ electrolyte, the section on the left is the LSM current collector, and the middle is the three phase active cathode.