Download
1 / 7
80 likes | 324 Vues
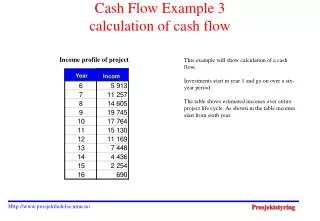
Year. Income. Cash Flow Example 3 calculation of cash flow. Income profile of project. This example will show calculation of a cash flow. Investments start in year 1 and go on over a six-year period

E N D
Year Income Cash Flow Example 3 calculation of cash flow Income profile of project This example will show calculation of a cash flow. Investments start in year 1 and go on over a six-year period The table shows estimated incomes over entire project life cycle. As shown in the table incomes start from sixth year. Http://www.prosjektledelse.ntnu.no
Preplanning Detailed Planning Construction - Section A - Section B - Section C Assembly Prod. start Testing Pilot operation År 7 År 6 Year1 Year 2 Year 3 Year 4 Year 5 Rough Schedule We will look at cost sheet of project A rough schedule which is shown in left side is set for investment over 5 years.Here we see when the different activities of project will be implemented. Http://www.prosjektledelse.ntnu.no
Cost Cost category Magnitude preplanning 880 Detailed planning 475 Construction section A 313 Construction section B 784 Construction section C 465 Assembly 738 testing 160 Pilot operation 700 Project management 159 Unpredicted 390 SUM 5 064 Cost Estimate (kNOK ) We have prepared a cost estimate for the costs. The needed accumulated investment is little over 5 mill. NOK and the left table shows how large the cost of each activity is. Http://www.prosjektledelse.ntnu.no
COST Cost category YEAR 1 YEAR 2 YEAR 3 YEAR 4 YEAR 5 AMOUNT Preplanning 880 880 Detailed planning 350 125 475 Construction section A 110 203 313 Construction section B 784 784 Construction section C 230 235 465 Assembly 490 248 738 testing 160 160 Pilot operation 300 400 700 Project management 35 35 35 35 19 159 Unpredicted 80 80 80 80 70 390 SUM 1455 1457 840 823 489 5 064 Investment profile (kNOK) By dividing the costs on different periods, we can create an investment profile for project. For activity, detail planning, total sum is 475 kNOK that is divided on year 1 and 2, that gives respectively 350 and 125. In addition to investment costs, there will be tax, operation and maintenance costs. In this example, we disregard taxes. Http://www.prosjektledelse.ntnu.no
Cost Fixed Part Varying Part Total Cost Year Operation & Maintenance Cost (kNOK) Left table shows operation and maintenance costs of project. We see that these costs do not occur before 6th year; the time that construction is over. Operation and maintenance costs are splited into fixed and variable parts.. Http://www.prosjektledelse.ntnu.no
Cost / Income Year 1 Year2 Year 3 Year 4 Year 5 Year 6 Year 7 Year 8 Cost / Income Year 9 Year 10 Year 11 Year 12 Year 13 Yea14 Year 15 Year 16 Cash Flow (kNOK) We set up a table for entire years of project life cycle. Where we aggregate operation and maintenance costs and subtract the obtained sum from project incomes in order to calculate the net cash flow for each year. Http://www.prosjektledelse.ntnu.no
1000 NOK 20 18 16 14 12 10 8 6 4 2 560 -1 455 -1 457 -840 -489 13 623 17 099 14 546 10 682 -823 10 430 19 005 7 043 4 091 2 098 4 667 Year Graphical Presentation of Costs The cash flow enjoys both negative and positive amounts. Also from graphical presentation we can see that cash flow ascends from year 0 to year 9, then it descends until end of project. Http://www.prosjektledelse.ntnu.no