Download
1 / 26
260 likes | 406 Vues
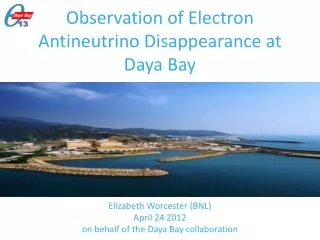
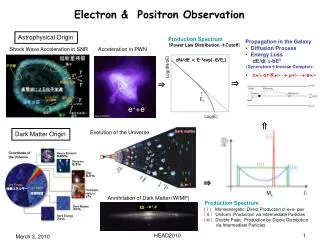
Observation of Electron Antineutrino Disappearance at Daya Bay. Elizabeth Worcester (BNL ) for the Daya Bay Collaboration DPF 2013, UC Santa Cruz August 16, 2013. 3 Neutrino Model. Flavor composition of neutrinos change as they propagate . |D m 2 32 | = 2.3 × 10 -3 eV 2.

E N D
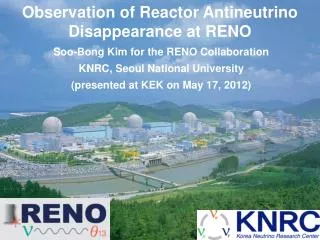
Observation of Electron Antineutrino Disappearance at Daya Bay Elizabeth Worcester (BNL) for the Daya Bay Collaboration DPF 2013, UC Santa Cruz August 16, 2013
3 Neutrino Model • Flavor composition of neutrinos change as they propagate |Dm232| = 2.3 × 10⁻³ eV2 Dm221= 7.5 × 10⁻⁵ eV2 • q23 ≈ 45o • Atmospheric, Accelerator • Octant unknown • q13≈10o • Short-Baseline Reactor, Accelerator • dCPunknown • q12 ≈ 35o • Solar, Long-Baseline Reactor ETW: DPF2013, UC Santa Cruz
Daya Bay Experiment Asia (20) Beijing Normal Univ., Chengdu Univ. of Sci and Tech, Chinese Univ. of Hong Kong, CGNPG, CIAE, Dongguan Polytech, IHEP, Nanjing Univ., Nankai Univ., National Chiao Tung Univ., National Taiwan Univ., National United Univ., NCEPU, Shandong Univ., Shanghai Jiao Tong Univ., Shenzhen Univ., Tsinghua Univ., Univ. of Hong Kong, USTC, Zhongshan Univ. North America (16) Brookhaven Natl’ Lab, Cal Tech, Cincinnati, Houston, Illinois, Illinois Institute of Technology, Iowa State, Lawrence Berkeley Natl’ Lab, Princeton, Rensselaer Polytech, Siena College, UC Berkeley, UCLA, Wisconsin, William & Mary, Virginia Tech Europe (2) Charles Univ., Dubna ~230 collaborators ETW: DPF2013, UC Santa Cruz
Reactor Neutrino Oscillation KamLAND Daya Bay Far Site Near detectors constrain flux ETW: DPF2013, UC Santa Cruz
Site: Guangdong, China Entrance to Daya Bay experiment tunnels Daya Bay NPP 2.9GW2 Ling AoNPP 2.9GW2 Ling Ao II NPP 2.9GW2 • 6 reactors: • 17.4 GW (thermal) total power • produce ~2×10²⁰ antineutrinos/ s/GW Mountains shield detectors from cosmic-ray induced background ETW: DPF2013, UC Santa Cruz
Experiment Layout EH3 EH2 EH1 ETW: DPF2013, UC Santa Cruz
Antineutrino Detection Inverse β-decay (IBD): s Prompt positron: Carries antineutrino energy Ee+≈Eν – 0.8 MeV Delayed neutron capture: Efficiently tags antineutrino signal Prompt + Delayed coincidence provides distinctive signature ETW: DPF2013, UC Santa Cruz
Antineutrino Detectors (ADs) Automated calibration unit (ACU) • 6 “functionally identical” ADs • ~110 tons total • ~20 tons Gd-doped LS • ~20 tons LS • ~40 tons mineral oil • 192 8” PMTs Gd-doped liquid scintillator Liquid scintillator γ-catcher Reflectors at top and bottom of cylinder 3.1 m Mineral oil PMTs 5 m ETW: DPF2013, UC Santa Cruz
Interior of AD ETW: DPF2013, UC Santa Cruz
Muon Tagging System • Water Pool acts as shield and Cerenkov detector • 4-layer RPC modules above pool Passive shielding demonstration: reconstructed position of AD single events during filling of pool: Air Water ETW: DPF2013, UC Santa Cruz
Data Collection arXiv: 1202.6181 A • A. Two Detector Comparison: • Sep. 23, 2011 – Dec. 23, 2011 • Side-by-side comparison of two EH1 detectors • B. First Oscillation Result: • Dec. 24, 2011 – Feb. 17, 2012 • All 3 halls (6 ADs) operating • First observation of νedisappearance • C. Current Oscillation Result: • Dec 24, 2011 – May 11, 2012 • More than 2.5x the previous data set • D. 6-AD Rate + Shape Analysis • Dec 24, 2011 – July 28, 2012 • Results coming soon EH1 • arXiv:1203.1669 B C arXiv: 1210.6327 EH2 EH3 ETW: DPF2013, UC Santa Cruz
Data Analysis Strategy Number of anti-neutrinos detected Detector target mass Distance from reactor to detector Detector efficiency Oscillation survival probability • Multiple Independent Analyses: • Common data set • Different • Energy calibration/reconstruction • Event selection/efficiency estimation • Background estimation • θ13 rate analysis • All yield consistent results • Blinded information: • True target masses • True distance from reactors to detectors • True reactor flux history ETW: DPF2013, UC Santa Cruz
Calibration: ACUs R=0 R=1.35m R=1.7725m Each ACU contains 3 sources on turntable: 68Ge source • 0 KE e+ = 2×0.511 MeV g • 10 Hz 241Am-13C neutron source • 3.5 MeV n without g • 0.5 Hz 60Cogamma source • 1.173+1.332 MeV g • 100 Hz LEDdiffuser ball • 500 Hz ACUs deploy sources along 3 axes: center of target, edge of target, center of gamma catcher Calibration also makes use of spallation neutron data taken simultaneously with IBD data during regular physics data collection. ETW: DPF2013, UC Santa Cruz
Side-by-Side Comparison Detailed comparisons and crosschecks possible with multiple detectors. Single events: Spallation neutron capture: AD1 AD2 νeenergy window Response of all detectors to neutrons constrains largest uncorrelated systematic uncertainty. The two ADs in Hall 1 have functionally identical spectra and response. ETW: DPF2013, UC Santa Cruz
Correlated IBD Signature • IBD Selection • Reject “flashers” • Prompt positron: 0.7 MeV < Ep < 12 MeV • Delayed neutron: 6.0 MeV < Ed < 12 MeV • Capture Time: 1 μs< Δt < 200 μs • Muon Veto • Pool muon: veto following 0.6 ms • AD muon (> 20 MeV): veto following 1 ms • AD shower muon (>2.5 GeV): veto following 1 s • Multiplicity • No other signal > 0.7 MeV within ±200 μsof IBD IBD Clear separation of antineutrino IBD events from most other signals ETW: DPF2013, UC Santa Cruz
Eμ>4 GeV (visible) Background Constrain fast-n rate usingIBD-like signals with high energy Estimate 9Li rate using time-correlation with muon • Total background: • 5% (2%) in far (near) halls • Uncertainty: • 0.3% (0.2%) in far (near) halls Time since muon (s) ETW: DPF2013, UC Santa Cruz
Data Summary ETW: DPF2013, UC Santa Cruz
Antineutrino Rate vs. Time Detected rate strongly correlated with reactor flux expectations. • Predicted Rate:(in figure) • Normalization is determined by fit to data • Absolute normalization is within a few percent of expectations ETW: DPF2013, UC Santa Cruz
Systematic Uncertainties For oscillation analysis, only uncorrelated uncertainties are used. • Largest systematic uncertainties: • Delayed energy cut • Gd capture ratio • Smaller than far site statistical uncertainty Influence of uncorrelated reactor systematics (0.8%) is only 0.04% on oscillation analysis. ETW: DPF2013, UC Santa Cruz
sin2(2θ13): Rate Analysis • Uses standard χ2 approach • Far vs. near relative measurement • Absolute rate is not constrained • Consistent results obtained by independent analyses, differentreactor flux models ETW: DPF2013, UC Santa Cruz
sin2(2θ13): Rate Analysis • Uses standard χ2 approach • Far vs. near relative measurement • Absolute rate is not constrained • Consistent results obtained by independent analyses, differentreactor flux models Most precise measurement of sin22θ13 to date sin22θ13 = 0.089 ± 0.010 (stat) ± 0.005 (syst) ETW: DPF2013, UC Santa Cruz
sin2(2θ13): Global Results ETW: DPF2013, UC Santa Cruz
Far vs. Near Comparison • Measurement of sin2(2q13) is based only on deficit in rate of observed events at far site: R = Nobs/Nexp = 0.944 ± 0.007 (stat) ± 0.003 (syst) Clear observation of far site deficit Spectral distortion consistent with oscillation.* *Spectral systematics not fully studied; θ13 value from shape analysis not recommended. • Rate + shape analysis in progress: • Full analysis of spectral shape requires understanding of: • Spectral shape of background • Detector energy response • Sensitive to both sin2(2q13) and |Dm2ee| • Rate + shape analysis using full 6-AD data period to be announced soon ETW: DPF2013, UC Santa Cruz
Recent Activity Final 2 ADs installed fall 2012. Daya Bay has been taking data with 8 ADs since October 2012. Special calibration data, some making use of the MCS* for 4p source calibration, was taken in fall 2012. *Manual Calibration System ETW: DPF2013, UC Santa Cruz
Projected Daya Bay Precision sin2(2q13) Precision (68% C.L.) 1st rate + shape result (coming soon) Dm2ee Precision (68% C.L.) Data collected to date Dm2mm (MINOS) arXiv:1304.6335 ETW: DPF2013, UC Santa Cruz
Summary • The Daya Bay reactor neutrino experiment has made an unambiguous observation of reactor electron-antineutrino disappearance at ~2 km: • R = 0.944 ± 0.007 (stat) ± 0.003 (syst) • Interpretation of disappearance as neutrino oscillation yields: • sin22θ13= 0.089 ± 0.010 (stat) ± 0.005 (syst) • Special calibration data, including 4p calibration of AD1, was taken in fall 2012. • Final two ADs were installed in fall 2012. Daya Bay has been taking 8-AD data since October 2012. • Rate + shape measurement of sin2(2q13) and |Dm2ee| coming soon. ETW: DPF2013, UC Santa Cruz