Download

1 / 36
360 likes | 377 Vues
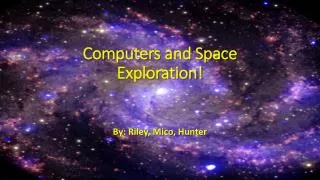
This article discusses the use of visualization and high-speed research networks in space exploration and collaboration, including examples from Mars exploration and the OptIPuter project. The article also explores the benefits of wall displays and the Scalable Adaptive Graphics Environment (SAGE) in analyzing large and high-resolution data.

E N D
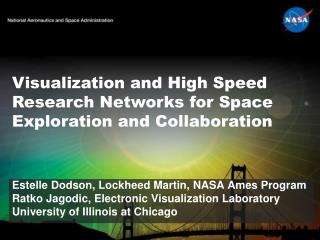
Visualization and High Speed Research Networks for Space Exploration and Collaboration Estelle Dodson, Lockheed Martin, NASA Ames Program Ratko Jagodic, Electronic Visualization Laboratory University of Illinois at Chicago
First Image from the Opportunity Mars Exploration Rover Initial Navcam image prior to mast deployment showing the bedrock outcrop in Eagle Crater
Portion of Opportunity’s “Mission Success” Pancam Panorama, Approximate Color, Sol 2-3 Outcrop in Eagle Crater
Eagle Crater trench bounce marks outcrop tracks Opportunity Navcam image looking back at Eagle Crater – a 22 meter diameter, 3 meter deep crater.
Sol 14 Layering and In-Place Spherules False color Pancam image of outcrop at Eagle Crater
Last Chance Outcrop 7 cm Cross Beds
1 cm MI Mosaic on Last Chance With Cross Beds
Sol 29 McKittrick Microscopic Imager Data Spherules (Hematite concretions)
MER Team Planning Last Chance Campaign 20 February 2004 on Sol 27 planning MI in El Capitan area of Eagle Crater. Panorama on the table has been printed approximately life size. (image: by W. Clancey)
MER Team Planning Last Chance Campaign 20 February 2004 on Sol 27 planning MI in El Capitan area of Eagle Crater. Panorama on the table has been printed approximately life size. (image: by W. Clancey)
MER Team Planning Last Chance Campaign 20 February 2004 on Sol 27 planning MI in El Capitan area of Eagle Crater. Panorama on the table has been printed approximately life size. (image: by W. Clancey)
MER Team Planning Last Chance Campaign 20 February 2004 on Sol 27 planning MI in El Capitan area of Eagle Crater. Panorama on the table has been printed approximately life size. (image: by W. Clancey)
NASA Ames Interactive 3D Terrain Visualization, Simulation, and Analysis – Mercator
Mercator – Antares adaptation for Mars Science Laboratory Mission
Mercator – capabilities • Interactive 3D large scale terrain & environment visualization • Robotic simulation • Interactive lighting simulation (shadows) • Multispectral overlays with transparency • Scene interrogation tools (measurement) • Science operations planning (targets, waypoints)
Massive Solar Flare Observed June 7, 2011, by the Solar Dynamics Observatory (SDO) SDO downloads ~1.5 TB/day compressed 5 TB/day uncompressed
Distributed Research Institutes: NAI and NLSI Supercomputing follows similar models
The Future Ratko Jagodic Electronic Visualization Laboratory University of Illinois at Chicago
As we have seen, NASA needs are: • Collocated and remote collaboration • Large and high-resolution data analysis and problem solving • Access to remote supercomputing resources
The OptIPuter is a NSF Information Technology Research project to examine a new model of computing whereby ultra high speed networks form the backplane of a planetary scale computer. • The projects partners include UCSD, UIC, NU, SDSU, TAMU, UCI, UIUC/NCSA, USC/ISI; affiliate partners are USGS EROS Data Center, NASA, UvA, SARA (Netherlands), KISTI (Korea), AIST (Japan) • Optiputer research focuses on developing technology to enable the real time collaboration and visualization of very large data-sets in the service of science - in particular earth sciences and the biosciences www.optiputer.net
StorageCluster StorageCluster End User ComputeCluster HD Videoconferencing RemoteInstrument(s) ComputeCluster End User
International Gigabit Networks - GLIF Founding Partners: UIC (EVL), Northwestern and Argonne National Laboratory
Wall Displays for Data-Intensive Problems • Problems keep increasing in scale and complexity, requiring interdisciplinary collaboration between scientists • Limited human cognition - desktop systems not suitable anymore • Wall display benefits: • Large size: • Promotes physical navigation • Enables collaboration • High resolution • Reduces context switching (see bigger picture) • Improves spatial performance • How to use wall displays as ”lenses” to collaboratively visualize large high-resolution data in the distributed Optiputer model?
Scalable Adaptive Graphics Environment (SAGE) • Turns any tiled-display into a single desktop • Multiple applications • Streamed remotely over high-speed networks • Application windows can be freely moved and resized • Works with pixels: the lowest common denominator for all visual information • Allows scientists to use remote storage, visualization and compute resources to collaboratively analyze multiple pieces of data
Use Cases - Financial Analysis • Desktop OS does not scale to wall displays • Juxtaposition of information allows us to see the “bigger picture”
Use Cases – NASA’s ENDURANCE Project • Wall displays provide focus AND context • Groups can analyze multiple heterogeneous pieces of data…
Use Cases – NASA’s ENDURANCE Project …or a single high-resolution dataset
Use Cases – Visual Analytics Class • 80% students felt they learned more in this space • Externalized students memory
Use Cases – Collaborative Analysis • Wall displays foster collaboration • Allow experimentation with the data, providing new insights
See the future today…the exhibit hall! www.sagecommons.org www.optiputer.net www.glif.is Thank You
The Future of Scientific Collaboration High Performance Computing Advanced Networks Visualization