Population Genetics:
Population Genetics:. How do Genes Move through Time and Space?. How Do We Characterize Variation?. Variation can be smooth or discontinuous. Two views of biology “Naturalists” Supported Darwin’s ideas. “Experimentalists” -Supported Mendelian Ideas. Naturalists’ Viewpoint.

Population Genetics:
E N D
Presentation Transcript
Population Genetics: How do Genes Move through Time and Space?
How Do We Characterize Variation? • Variation can be smooth or discontinuous. • Two views of biology • “Naturalists” • Supported Darwin’s ideas. • “Experimentalists” • -Supported Mendelian Ideas.
Naturalists’ Viewpoint • Saw most traits in a population exhibited a continuum of forms. • Believed the ability to survive and reproduce might depend on having traits that fall within some range of a spectrum. • Believe that traits within populations change or evolve as features of environmental change.
Experimentalists’ Viewpoint • Rejected naturalists’ view of evolution. • Viewed variation as a sudden change due to mutations. • Maintained evolution progressed by leap and bounds by sudden random mutations. • Evolution could not be a gradual process
Stalemate Broken • Herman Nilsson-Ehle (1909) • Using wheat kernels proved that traits that appear in populations as a continuous spectrum of forms with a genetic basis.
Stalemate Broken • Nilsson-Ehle showed a cross between • true-breeding red- and white-kerneled plants • produced all light red-kerneled plants • Cross between light red-kerneled plants yielded 7 categories of color.
Frequency Diagrams Illustrate Variation • Useful graphing tool for illustrating variation in population • X-axis:range of different forms that a trait can exhibit • Y-axis number of individuals in population that exhibit each form of the trait
Frequency Diagram of Human Height • Graphing human height creates a bell-shaped curve. • So many different forms that the categories blend.
Frequency Diagram of Wheat Kernels • Frequency diagrams of Nilsson-Ehle F2 variation. • Plants grown in controlled laboratory vs. those grown in the wild • Proved that genes can be responsible for seven different forms.
Continuous Variation is Determined by Two or More Genes • Polygenic (quantitative) traits: • Influenced by two or more genes residing at different loci on the same or on different chromosomes.
How Do Populations Differ? • Brachydactyly • Human trait in which the terminal bones of the fingers and toes do not grow their normal length
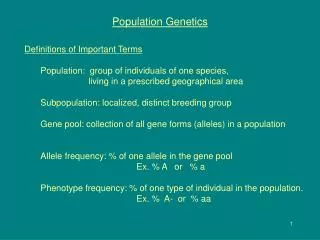
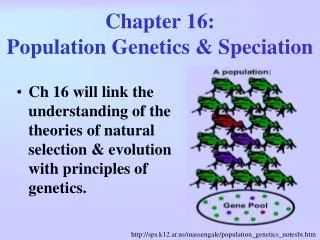
Populations are Collections of Alleles • Populations: • Group of interbreeding organisms of the same species that exist together in both time and space. • Gene pools: • All of the alleles found in the population. • Think of a beanbag • Beans are analogous to alleles and the entire bag of beans is the population’s gene pool.
Alleles Occur at Certain Frequencies • Example: gene pool for sickle cell anemia • Possible alleles humans could have: HBA or HBS • If we let p = HBA and q = HBS, the sum should equal 100 % of the alleles in the gene pool. • This could be rewritten p + q = 1
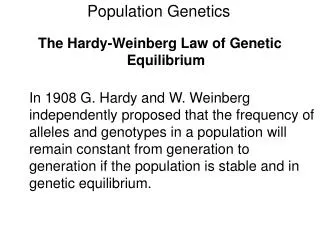
Hardy Weinberg Principle • Makes it possible to calculate allele frequencies (p, q) based on phenotypes. • Can calculate the sum of the genotypes: p2 + 2pq + q2 = 1 p2 =frequency of homozygous dominant genotype 2pq =frequency of heterozygous genotype q2 = frequency of homozygous recessive genotype
Hardy Weinberg Principle • States allele frequencies for a population will remain the same from generation to generation as long as specific conditions are met. • Populations in which p and q do not change are said to be in a genetic equilibrium.
Hardy Weinberg Principle • Required conditions for genetic equilibrium: • 1. Populations are large. • 2. Individuals mate randomly. • 3. Populations do not gain or lose individuals. • 4. Natural selection is not occurring in the population. • 5. Mutation is not occurring at a high enough rate to influence genetic variation.
Hardy Weinberg Principle • Power of this principle: • Allows us • To calculate what would happen if natural selection were not occurring • To compare what does happen in the real world • Also allows us to calculate the proportions of individuals in the population that have each of the three possible genotypes.
Microevolution • Definition: Change in allele frequencies in a gene pool over time • Factors that contribute to microevolution: • Natural selection • Genetic Drift • Founder effect • Bottleneck effect • Mutation • Gene flow
Natural Selection • Example of natural selection: industrial melanism • Rapid shift in the color of peppered moth populations during the 19th century in England
Natural Selection • Color of moth due to pair of alleles: • Carbonaria = M • Speckled = m • Before industrialism: • Speckled moths had advantage because their coloring served to camouflage them
Natural Selection • After industrialism: • Lichens on the trees died. • Made speckled moths visible. • Darker moths were more likely to survive. • Resulted in change in the allele frequency of the population.
Natural Selection • Heterozygote advantage: • Tendency of red blood cells to sickle makes these cell resistant to penetration by the parasite that causes malaria. • Heterozygotes can survive disease and have immunity against malaria.
Types of Selection • Directional selection • Selection that acts on one extreme of the range of variation for a particular characteristic. • Example: Frog tongue length.
Types of Selection • Stabilizing selection • Selection that operates against the extremes in the distribution of a particular trait in a population. • Example: human birth weight
Types of Selection • Disruptive selection • Selection that favors the extremes and disfavors the middle range of particular traits in a population. • Example: bird beak size
Some Changes in Allelic Frequency Are Random • Genetic Drift: • Random change in allelic frequencies as a result of chance alone. • Seen in small populations • Two types: • Founder effect • Bottlenecks • Often referred to as neutral selection • Occurs independent of natural selection
Founder effect • Eventual genetic difference between an isolated offshoot population and the original population from which it came. • Example: Pennsylvania Amish, settlers of Tristan da Cunha
Bottlenecks • A drastic decrease in the size of a population with a resulting decrease in the genetic variability within a population. • Usually due to a catastrophe (drought, hunting, flood etc.)
Mutation • A permanent change in the genetic material of a cell or organism. • Can be inherited from generation to generation. • Introduces new alleles into the population • Effects can be lethal, neutral or advantageous in a population.
Gene Flow • A shift in the allelic frequencies within a population and between populations resulting from migration. • Either immigration or emigration • Example: DDT and mosquitoes