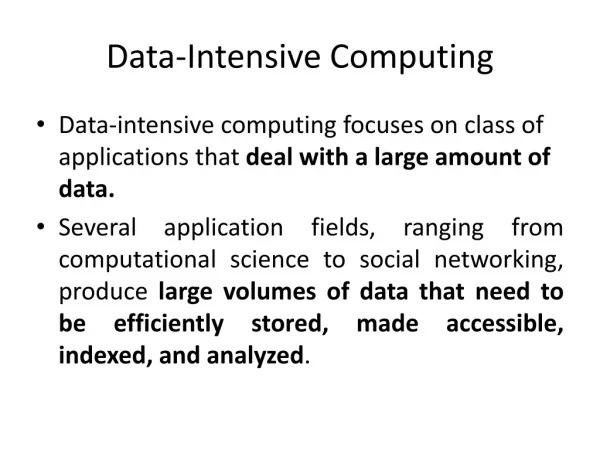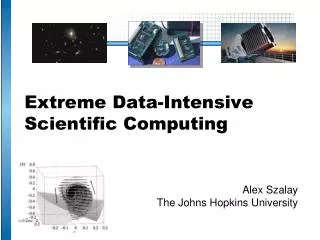
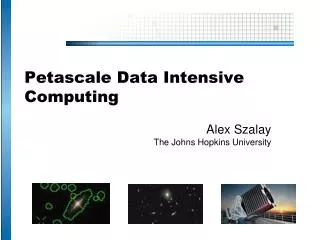
Petascale Data Intensive Computing
Petascale Data Intensive Computing. Alex Szalay The Johns Hopkins University. Living in an Exponential World. Scientific data doubles every year caused by successive generations of inexpensive sensors + exponentially faster computing Changes the nature of scientific computing

Petascale Data Intensive Computing
E N D
Presentation Transcript
Petascale Data Intensive Computing Alex SzalayThe Johns Hopkins University
Living in an Exponential World • Scientific data doubles every year • caused by successive generations of inexpensive sensors + exponentially faster computing • Changes the nature of scientific computing • Cuts across disciplines (eScience) • It becomes increasingly harder to extract knowledge • 20% of the world’s servers go into huge data centers by the “Big 5” • Google, Microsoft, Yahoo, Amazon, eBay • So it is not only the scientific data!
Astronomy Trends CMB Surveys (pixels) • 1990 COBE 1000 • 2000 Boomerang 10,000 • 2002 CBI 50,000 • 2003 WMAP 1 Million • 2008 Planck 10 Million • Angular Galaxy Surveys (obj) • 1970 Lick 1M • 1990 APM 2M • 2005 SDSS 200M • 2009 PANSTARRS 1200M • 2015 LSST 3000M • Time Domain • QUEST • SDSS Extension survey • Dark Energy Camera • PanStarrs • SNAP… • LSST… • Galaxy Redshift Surveys (obj) • 1986 CfA 3500 • 1996 LCRS 23000 • 2003 2dF 250000 • 2005 SDSS 750000 Petabytes/year by the end of the decade…
Collecting Data • Very extended distribution of data sets: data on all scales! • Most datasets are small, and manually maintained (Excel spreadsheets) • Total amount of data dominated by the other end(large multi-TB archive facilities) • Most bytes today are collected via electronic sensors
Next-Generation Data Analysis • Looking for • Needles in haystacks – the Higgs particle • Haystacks: Dark matter, Dark energy • Needles are easier than haystacks • ‘Optimal’ statistics have poor scaling • Correlation functions are N2, likelihood techniques N3 • For large data sets main errors are not statistical • As data and computers grow with Moore’s Law, we can only keep up with N logN • A way out: sufficient statistics? • Discard notion of optimal (data is fuzzy, answers are approximate) • Don’t assume infinite computational resources or memory • Requires combination of statistics & computer science • Clever data structures, new, randomized algorithms
Data Intensive Scalable Computing • The nature of scientific computing is changing • It is about the data • Adding more CPUs makes the IO lag further behind • Getting even worse with multi-core • We need more balanced architectures
Amdahl’s Laws Gene Amdahl (1965): Laws for a balanced system • Parallelism: max speedup is S/(S+P) • One bit of IO/sec per instruction/sec (BW) • One byte of memory per one instruction/sec (MEM) • One IO per 50,000 instructions (IO) Modern multi-core systems move farther away from Amdahl’s Laws (Bell, Gray and Szalay 2006) For a Blue Gene the BW=0.013, MEM=0.471. For the JHU cluster BW=0.664, MEM=1.099
Gray’s Laws of Data Engineering Jim Gray: • Scientific computing is revolving around data • Need scale-out solution for analysis • Take the analysis to the data! • Start with “20 queries” • Go from “working to working”
Reference Applicatons Several key projects at JHU • SDSS: 10TB total, 3TB in DB, soon 10TB, in use for 6 years • NVO Apps: ~5TB, many B rows, in use for 4 years • PanStarrs: 80TB by 2009, 300+ TB by 2012 • Immersive Turbulence: 30TB now, 300TB next year,can change how we use HPC simulations worldwide • SkyQuery: perform fast spatial joins on the largest astronomy catalogs / replicate multi-TB datasets 20 times for much faster query performance (1Bx1B in 3 mins) • OncoSpace: 350TB of radiation oncology images today, 1PB in two years, to be analyzed on the fly • Sensor Networks: 200M measurements now, billions next year, forming complex relationships
Sloan Digital Sky Survey Goal Create the most detailed map of the Northern sky “The Cosmic Genome Project” Two surveys in one Photometric survey in 5 bands Spectroscopic redshift survey Automated data reduction 150 man-years of development High data volume 40 TB of raw data 5 TB processed catalogs Data is public 2.5 Terapixels of images Now officially FINISHED The University of Chicago Princeton University The Johns Hopkins University The University of Washington New Mexico State University Fermi National Accelerator Laboratory US Naval Observatory The Japanese Participation Group The Institute for Advanced Study Max Planck Inst, Heidelberg Sloan Foundation, NSF, DOE, NASA
SDSS Now Finished! • As of May 15, 2008 SDSS is officially complete • Final data release (DR7.2) later this year • Final archiving of the data in progress • Paper archive at U. Chicago Library • Digital Archive at JHU Library • Archive will contain >100TB • All raw data • All processed/calibrated data • All version of the database • Full email archive and technical drawings • Full software code repository
Database Challenges • Loading (and scrubbing) the Data • Organizing the Data (20 queries, self-documenting) • Accessing the Data (small and large queries, visual) • Delivering the Data (workbench) • Analyzing the Data (spatial, scaling…)
EDR DR1 DR1 DR2 DR2 DR2 DR3 DR3 DR3 DR3 Data Versions • June 2001: EDR • Now at DR6, with 3TB • 3 versions of the data • Target, Best, Runs • Total catalog volume 5TB • Data publishing: once published, must stay • SDSS: DR1 is still used
Visual Tools • Goal: • Connect pixel space to objects without typing queries • Browser interface, using common paradigm (MapQuest) • Challenge: • Images: 200K x 2K x1.5K resolution x 5 colors = 3 Terapix • 300M objects with complex properties • 20K geometric boundaries and about 6M ‘masks’ • Need large dynamic range of scales (2^13) • Assembled from a few building blocks: • Image Cutout Web Service • SQL query service + database • Images+overlays built on server side -> simple client
User Level Services • Three different applications on top of the same core • Finding Chart (arbitrary size) • Navigate (fixed size, clickable navigation) • Image List (display many postage stamps on same page) • Linked to • One another • Image Explorer (link to complex schema) • On-line documentation
Images • 5 bands, 2048x1489 resolution (u,g,r,i,z), 6MB each • Raw size 200Kx6MB = 1.2TB • For quick access they must be stored in the DB • It has to show well on screens, remapping needed • Remapping must be uniform, due to image mosaicking • Built composite color, using lambda mapping • (g->B, r->G, i->R), u,z was too noisy • Many experiments, discussions with Robert Lupton • Asinh compression • Resulting image stored as JPEG • From 30MB->300kB : a factor 100 compression
Object Overlays • Object positions stored in (ra,dec) • At run time, convert (ra,dec)-> (screen_x, screen_y) • Plotting pixel space quantities, like outlines: • We could do (x,y)->(ra,dec)->(screen) • For each field we store local affine transformation matrix: • (x,y) -> (screen) • Apply local projection matrix and plot in pixel coordinates • GDI plots correctly on the screen! • Whole web service less than 1500 lines of C# code
Geometries • SDSS has lots of complex boundaries • 60,000+ regions • 6M masks, represented as spherical polygons • A GIS-like library built in C++ and SQL • Now converted to C# for direct plugin into SQL Server2005 (17 times faster than C++) • Precompute arcs and store in database for rendering • Functions for point in polygon, intersecting polygons, polygons covering points, all points in polygon • Using spherical quadtrees (HTM)
Spatial Queries in SQL • Regions and convexes • Boolean algebra of spherical polygons (Budavari) • Indexing using spherical quadtrees (Samet) • Hierarchical Triangular Mesh (Fekete) • Fast Spatial Joins of billions of points • Zone algorithm (Nieto-Santisteban) • All implemented in T-SQL and C#, runninginside SQL Server 2005
Common Spatial Queries Points in region • Find all objects in this region • Find all “good” objects (not in masked areas) • Is this point in any of the surveys Region in region • Find surveys near this region and their area • Find all objects with error boxes intersecting region • What is the common part of these surveys Various statistical operations • Find the object counts over a given region list • Cross-match these two catalogs in the region
User Defined Functions • Many features implemented via UDFs, written in either T-SQL or C#, both scalar and TVF • About 180 UDFs in SkyServer • Spatial and region support • Unit conversions (fMjdToGMT, fMagToFlux, etc) • Mapping enumerated values • Metadata support (fGetUrl*)
Public Use of the SkyServer • Prototype in data publishing • 470 million web hits in 6 years • 930,000 distinct usersvs 15,000 astronomers • Delivered 50,000 hoursof lectures to high schools • Delivered >100B rows of data • Everything is a power law • Interactive workbench • Casjobs/MyDB • Power users get their own database, no time limits • They can store their data server-side, link to main data • They can share results with each other • Simple analysis tools (plots, etc) • Over 2,200 ‘power users’ (CasJobs)
Skyserver Sessions Vic Singh et al (Stanford/ MSR)
Why Is Astronomy Special? • Especially attractive for the wide public • Community is not very large • It has no commercial value • No privacy concerns, freely share results with others • Great for experimenting with algorithms • It is real and well documented • High-dimensional (with confidence intervals) • Spatial, temporal • Diverse and distributed • Many different instruments from many different places and times • The questions are interesting • There is a lot of it (soon petabytes) WORTHLESS!
The Virtual Observatory • Premise: most data is (or could be online) • The Internet is the world’s best telescope: • It has data on every part of the sky • In every measured spectral band: optical, x-ray, radio.. • As deep as the best instruments (2 years ago). • It is up when you are up • The “seeing” is always great • It’s a smart telescope: links objects and data to literature on them • Software became the capital expense • Share, standardize, reuse..
National Virtual Observatory • NSF ITR project, “Building the Framework for the National Virtual Observatory” is a collaboration of 17 funded and 3 unfunded organizations • Astronomy data centers • National observatories • Supercomputer centers • University departments • Computer science/information technology specialists • Similar projects now in 15 countries world-wide => International Virtual Observatory Alliance
SkyQuery • Distributed Query tool using a set of web services • Many astronomy archives from Pasadena, Chicago, Baltimore, Cambridge (England). • Implemented in C# and .NET • After 6 months users wanted to perform joinsbetween catalogs of ~1B cardinality • Current time for such queries is 1.2h • We need a parallel engine • With 20 servers we can deliver 5 minturnaround for these joins
The Crossmatch Problem • Given several catalogs, find the tuples that correspond to the same physical object on the sky • Increasingly important with time-domain surveys • Results can be of widely different cardinalities • Resulting tuple has a posterior probability (fuzzy) • Typically many-to-many associations, only resolved after applying a physical prior • Combinatorial explosion of simple neighbor matches • Very different plans needed for different cardinalities • Semi-join, filter first • Taking proper motion into account, if known • Geographic separation of catalogs
SkyQuery: Interesting Patterns • Sequential cross-match of large data sets • Fuzzy spatial join of 1B x 1B • Several sequential algorithms, require sorting • Can be easily parallelized • Current performance • 1.2 hours for 1B x 1B on a single server over whole sky • Expect 20-fold improvement on SQL cluster • How to deal with “success”? • Many users, more and more random access • Ferris Wheel • Circular “scan machine”, you get on any time, off after one circle • Uses only sequential reads • Can be distributed through synchronizing (w. Grossman) • Similarities to streaming queries
Simulations Cosmological simulations have 109 particles and produce over 30TB of data (Millennium, Aquarius, …) • Build up dark matter halos • Track merging history of halos • Use it to assign star formation history • Combination with spectral synthesis • Realistic distribution of galaxy types • Too few realizations (now 50) • Hard to analyze the data afterwards ->need DB (Lemson) • What is the best way to compare to real data?
Pan-STARRS • Detect ‘killer asteroids’ • PS1: starting in November 2008 • Hawaii + JHU + Harvard/CfA + Edinburgh/Durham/Belfast + Max Planck Society • Data Volume • >1 Petabytes/year raw data • Over 5B celestial objectsplus 250B detections in database • 80TB SQLServer database built at JHU,the largest astronomy DB in the world • 3 copies for redundancy • PS4 • 4 identical telescopes in 2012, generating 4PB/yr
PS1 Table Sizes - Monolithic Sizes are in TB
Immersive Turbulence • Understand the nature of turbulence • Consecutive snapshots of a 1,0243 simulation of turbulence:now 30 Terabytes • Soon 6K3 and 300 Terabytes (IBM) • Treat it as an experiment, observethe database! • Throw test particles in from your laptop,immerse yourself into the simulation,like in the movie Twister • New paradigm for analyzing HPC simulations! with C. Meneveau, S. Chen (Mech. E), G. Eyink (Applied Math), R. Burns (CS)
Sample code (gfortran 90!) running on a laptop - - - advect backwards in time ! minus Not possible during DNS
Life Under Your Feet • Role of the soil in Global Change • Soil CO2 emission thought to be>15 times of anthropogenic • Using sensors we can measure itdirectly, in situ, over a large area • Wireless sensor network • Use 200 wireless (Intel) computers, with 10 sensors each, monitoring • Air +soil temperature, moisture, … • Few sensors measure CO2 concentration • Long-term continuous data, >200M measurements/year • Complex database of sensor data, built from the SkyServer with K.Szlavecz (Earth and Planetary), A. Terzis (CS) http://lifeunderyourfeet.org/
CO2 Flux tower Next deployment • Integration with Baltimore Ecosystem Study LTER • End of July 08 • Deploy 200 2nd gen motes • Goal: Improve understanding of coupled water and carbon cycle in the soil • Use better sensors
Ongoing BES Data Collection Welty and McGuire 2006
Commonalities • Huge amounts of data, aggregates needed • But also need to keep raw data • Need for parallelism • Requests enormously benefit from indexing • Very few predefined query patterns • Everything goes…. • Rapidly extract small subsets of large data sets • Geospatial everywhere • Data will never be in one place • Remote joins will not go away • Not much need for transactions • Data scrubbing is crucial
Scalable Crawlers • Recently lot of buzz about MapReduce • Old idea, new is the scale (>300K computers) • But it cannot do everything • Joins are notoriously difficult • Non-local queries need an Exchange step • On Petascale data sets we need to partition queries • Queries executed on tiles or tilegroups • Databases can offer indexes, fast joins • Partitions can be invisible to users, or directly addressed for extra flexibility (spatial) • Also need multiTB shared scratch space
Emerging Trends for DISC • Large data sets are here, solutions are not • Scientists are “cheap” • Giving them SW is not enough • Need recipe for solutions • Emerging sociological trends: • Data collection in ever larger collaborations (VO) • Analysis decoupled, off archived data by smaller groups • Even HPC projects choking on IO • Exponential data growth • > data will be never co-located • “Data cleaning” is much harder than data loading
Petascale Computing at JHU • We are building a distributed SQL Server cluster exceeding 1 Petabyte • Just becoming operational • 40x8-core servers with 22TB each, 6x16-core servers with 33TB each, connected with 20 Gbit/sec Infiniband • 10Gbit lambda uplink to StarTap • Funded by Moore Foundation, Microsoft and the Pan-STARRS project • Dedicated to eScience,will provide public access
IO Measurements on JHU System 1 server: 1.4 Gbytes/sec, 22.5TB, $12K
Components • Data must be heavily partitioned • It must be simple to manage • Distributed SQL Server cluster • Management tools • Configuration tools • Workflow environment for loading/system jobs • Workflow environment for user requests • Provide advanced crawler framework • Both SQL and procedural languages • User workspace environment (MyDB)
a b c d e f g h a a a a a a a a a b c d e f g h A’ B’ C’ D’ E’ F’ G’ H’ Data Layouts SkyQuery (a) replicated Turbulence (b) sliced Pan-STARRS (c) hierarchical
The Road Ahead • Build Pan-Starrs (be pragmatic) • Generalize to GrayWulf prototype • Fill with interesting datasets • Create publicly usable dataspace • Add procedural language support for user crawlers • Adopt Amazon-lookalike service interfaces • S4 -> Simple Storage Services for Science (Budavari) • Distributed workflows across geographic boundaries • (wolfpack…) • “Ferris-wheel”/streaming algorithms (w. B. Grossman) • “Data pipes” for distributed workflows (w. B. Bauer) • “Data diffusion” (w I. Foster and I. Raicu)
Continuing Growth How long does the data growth continue? • High end always linear • Exponential comes from technology + economics rapidly changing generations • like CCD’s replacing plates, and become ever cheaper • How many new generations of instruments do we have left? • Are there new growth areas emerging? • Software is also an instrument • hierarchical data replication • virtual data • data cloning
Technology+Sociology+Economics • Neither of them is enough • Technology changing rapidly • Sensors, Moore's Law • Trend driven by changing generations of technologies • Sociology is changing in unpredictable ways • YouTube, tagging,… • Best presentation interface may come from left field • In general, people will use a new technology if it is • Offers something entirely new • Or substantially cheaper • Or substantially simpler • Economics: funding is not changing