Download
1 / 27
270 likes | 358 Vues
This presentation explores the integration of Demand Response (DR) into wholesale markets, its impacts, and key observations regarding its role in the energy market design. It discusses the debate surrounding DR as a stranded resource, recent trends in DR programs, and performance metrics in different ISO markets. The presentation also covers the benefits, challenges, and proposed remedies to enhance the efficiency and reliability of DR programs.

E N D
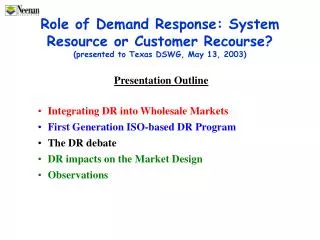
Role of Demand Response: System Resource or Customer Recourse?(presented to Texas DSWG, May 13, 2003) • Presentation Outline • Integrating DR into Wholesale Markets • First Generation ISO-based DR Program • The DR debate • DR impacts on the Market Design • Observations
Is DR a Stranded Resource 2003 ? 50% decrease in DSM spending Nationwide since the mid-1990s has also affected DSM-based capacity reductions
ICAP 1998 Legacy ALM 2003 1999 Implicit bilateral Day-ahead bid energy 2002 2003/4 2001 Day-ahead ancillaries 2002 2002 Class I Emergency 2000 2001 Real-time energy 2002 2001 2002 Integration DR into Wholesale Markets PJMISO ISO-NE NYISO ERCOT ISO
DA Warning, 2-hr. notice 2-hr. notice day-ahead Type 100 kW, Aggregations allowed Same 1 MW Bid increments Size CAP = Market Value Event = EDRP Greater of: $500 or LBMP DAM LBMP Payment Greater of: DAM or RT LBMP, plus 10% Penalty none same Participants 2001/2002 300/1600 12/24 Avg. Curtailed 25/18 425/675 NYISO PRL Programs ICAP/SCR Emergency Dispatched Economic Bid
Max MW Curtailed All Programs 2000 Avg and Max MW Curtailed Economic Program 1600 100 1200 75 Max. Hr. 800 50 400 25 Avg. Hourly PJM NY NE PJM NY NE ISO 2002 DR Program PerformanceLoads Curtailed
Avg. Payment $/MWH Total $ Payments $500 $5 Mil 95% $400 $4 Mil na % Emergency $300 $3 Mil 90% $200 $2 Mil $100 $1 Mil 60% Economic Emergency PJM NY NE PJM NY NE ISO 2002 DR Program Performance
$ 23 – 45 $ 2-16 $ 0.9 $ 0.5 $0.6 $0.1 $ 12.0 $ 0.3 $ 0.9 $ 0.2 $ 12.9 $ 0.8 $ 1.5 $ 0.3 6 - 15 0.75 - 4 7.4 3 NYISO DR Program Benefits 2001 and 2002 EDRP DADRP $ Million 2001 2002 2001 2002 Reliability indirect Market Price Impacts RTM Savings Hedge Savings $benefit/ * program payment. * Includes transfers among stakeholders
(Q4) The DR Debate • Distractions • Ownership – can’t sell what you don’t own • Measurement – can sell what can’t be measured • Participation – only large C&I customers can participate
The DR Debate • Misconceptions • Subsidies – uplift costs are subsidies • Double Payment – savings are reward enough • Benefits – net Social versus transfers • Reliability – dispatchers can’t count on it
The DR Debate • Issues of Substance and Discovery • Role of the ISO? Market maker or facilitator? • Benefits- transient and counterproductive? • Public versus private valuation 50% decrease in DSM spending Nationwide since the mid-1990s has also affected DSM-based capacity reductions
Changes to NYISO Capacity DR for 2003 • Uncoupling of ICAP/SCR and EDRP • 2001 & 2002: Joint EDRP and SCR allowed • 2003: Registration for only one program allowed • Dispatch of SCR and EDRP • 2001 & 2002: EDRP called concurrently with SCR • 2003: Called after ICAP/SCR • Price Setting • 2001 & 2002: DR did not set market price • 2003: Hybrid Pricing methodology allows for DR to set market price
Changes to NYISO Energy DR for 2003 • Noncompliance Penalty Rate • 2001 & 2002: 110% of higher of DAM or RTM LBMP • 2003: remove 10% adder • Program Marketing • 2001 & 2002: LSEs only • 2003: Any DSP (LSE and non-LSE) who meet NYISO credit worthiness requirements • Floor bid price of $50/MWH DSP = Demand Service Provider
ICAP Market Flaws: Basic Principles Growth of capacity will only occur if long-term profitability is expected Long-term sustainable capacity prices • Recent low capacity prices may force generators to shut down • New York’s excess capacity situation could turn to deficit • System and resource reliability could be jeopardized • Capacity prices will rise due to short supply
ICAP Market CollapseNYC Locality Month May June July August September October 2001 Monthly Auction $8.75 (249 MW) $12.50 (132 MW) $8.75 (200 MW) $6.00 (211 MW) $6.00 (203 MW) $5.95 (198 MW) 2002 Monthly Auction $10.09 (684 MW) $6.40 (434 MW) $4.80 (313 MW) $4.03 (224 MW) $3.38 (214 MW) $3.12 (204 MW) Upstate, markets cleared at $.01/MWH many months, even summer ones
Proposed Remedies • Set Floor prices on ICAP in Spot (deficiency) auction • Increased volume of transactions in capacity auctions • Stabilize bilateral contracts valuation • Conducive to attracting new generation projects in NYS • Introduction of demand curve into Spot Market Auction • Induce additional capacity investments • Increase available reserve margin • Standardize UCAP product in Northeast (under consideration) • Align procurement provisions • Adopt common provisions • Require forward ICAP contracting
Current Market Model Proposed Market Model D S S Price Price D Deficiency Rate Deficiency Rate Expanded reserves price Market Clearing Price 100% Reserve Req. 100% Q1 Reserve Req. 100% Reserve Requirement = 118% of NYCA/TO Peak Demand Reserve margin is higher Proposed Solution to Fix ICAP Market Flaws
Demand Curve Details • ICAP Spot Market Auction replaces Deficiency Auction • Demand curve used in this market only! • “Deficiency Rate” anchor increased over 3 year period Locality Year 1 Year 2 Year 3 ROS LI NYC $56.24 @ 100% $0.00 @ 112% $104.37 @ 100% $0.00 @ 118% $127.89 @ 100% $0.00 @ 118% $67.49 @ 100% $0.00 @ 112% $123.94 @ 100% $0.00 @ 118% $151.41 @ 100% $0.00 @ 118% Costs used will be defined by the results of a review in December of 2004
$127.89 DLI $104.37 $56.24 P3 P2 P1 Q2 Q1 Q3 Sample Demand Curve: Year 1 Price S D0 DNYC DROS P0 118% 132% Reserve Req. Zones with higher threshold price get higher reserve margins
Long-Term Implications of Demand Curve in ICAP Spot Market Auction • Use of Demand Curve will increase prices in ICAP Spot Market deficiency auction • ICAP “consumers” will wish to avoid these dramatically higher prices by buying in either NYISO strip/monthly auctions or through bilateral contracts • Increased demand will cause prices to increase in both auctions and for bilaterals • If prices remain stable at this increased level, excess capacity situation can be maintained and potentially increased over time • Total reserves will increase
Customers require short paybacks on DR investments Multi-year ICAP would benefit customer participation
Energy Market Flaws: SCD Dispatch/Pricing Problem • SCD thinks all Gas Turbines (GT) brought online as a reserve unit can be scheduled at any generation level regardless of blocking • If GT must be left on due to a minimum run-time constraint, SCD may back down a lower priced unit while allowing the higher-priced GT to set LBMP • FERC agreed, in response to a NYSEG complaint, that this pricing methodology is undesirable
Load Is Reduced P SCD Interval 1 P SCD Interval 2 D1 D2 S S P0 P1 Q Q Steam Steam GTs GTs Hybrid Pricing Methodology Details • If GTs no longer “needed”, GTs not fulfilling minimum run time requirements are moved to the bottom of bid stack • Shifts out supply curve so lower priced units appear at the margin • SCD allows price to be set by any GT who has fulfilled its minimum run time or by any another unit But, it can result in increased prices
Hybrid Pricing when DR Capacity Resources are Dispatched • Dispatchers calculate expected load reduction from SCR and input into SCD as proxy generator at highest strike price dispatched • If EDRP is also dispatched, a second entry is submitted to SCD with the expected load reduction from EDRP @ $500/MW • Calculate LBMP using Hybrid Pricing Rules Market prices will rise (not fall) when DR capacity resources are dispatched
Energy Market:Shortage Cost Pricing Flaws • NYISO operators required to convert 10-Min Non-Spinning reserves into energy to maintain 10-Min total reserve levels • Temporary reserve shortage conditions not reflected in energy prices only reserve prices • Reserve shortages have dramatic impact on energy if shortfall is extreme (e.g. demand exceeds supply) Average Real-time price during emergencies <$100/MWH
SCD Interval 2 SCD Interval 1 P 10 Min Spin Shortfall P D D S S Unit A 150 125 Q Q Example of Current SCD Dispatch • Unit A scheduled to provide 10 Minute Non-Spinning • Offered Reserve Price: $12 • Offered Energy Price: $100
Shortage Cost Pricing Model (SCPM) • SCPM intends to elevate SCD prices in area where 10-Minute total reserves are short • If NYCA-wide (Zones A - K), set the reference bus price to a value such that NYC zonal price would be $1,000/MWh • If East of Total East (Zones F - K), set prices in the East only such that NYC zonal price would be $1,000/MWh • Higher of original SCD (w/ Hybrid Pricing) and SCPM LBMP reported and used for all Real-Time energy settlement Market prices will rise (not fall) when DR capacity resources are dispatched
Observations DR in the NE • ICAP Participation will become a permanent fixture • Emergency programs will wax and wan • Ancillary services will emerge, but at a modest level • DR bidding in Day-Ahead market will be resolved in the next 1-2 years • Resource adequacy concerns may trump DR