Download
1 / 45
450 likes | 597 Vues
Dust and Molecules in Early Galaxies: Prediction and Strategy for Observations. Tsutomu T. TAKEUCHI Laboratoire d’Astrophysique de Marseille, FRANCE. Contents. Part I General Introduction Part II Dust Emission from Forming Galaxies

E N D
Dust and Molecules in Early Galaxies: Prediction and Strategy for Observations Tsutomu T. TAKEUCHI Laboratoire d’Astrophysique de Marseille, FRANCE Contents Part I General Introduction Part II Dust Emission from Forming Galaxies Part III IR Absorption Line Measurement of H2 in Early Galaxies Summary
Part I General Introduction
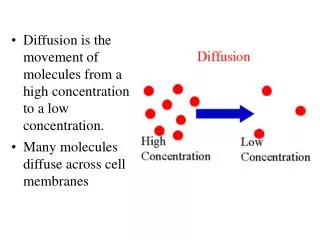
Star formation Heavy element production Dust formation Dust FIR UV Dust and Molecules in Early Galaxy Evolution 1. Absorption and Re-Emission of Radiation by Dust Short wavelength photons are scattered and absorbed by dust grains and re-emitted as FIR radiation.
2. Dust as a Catalyst of H2 Formation Dust works as a catalyst for the formation of molecular hydrogen (H2). Molecular formation is closely related to the star formation activity. Especially in an early phase of galaxy evolution, H2 molecules are very important coolant of gas to contract to form stars. Dust controls the early stage of star formation history in galaxies! (Hirashita et al. 2002; Hirashita & Ferrara 2002). Without dust, star formation does not proceed effectively.
Motivation For understanding the physics of galaxy formation and early evolution, and testing various models, it is crucial to measure their physical quantities related to the metal enrichment, dust production, and molecular gas amount. We focus on the two systems: 1. Young systems with active dust production Observation of the continuum radiation from dust. 2. Dense systems with little metal/dust Measurement of H2 through IR absorption lines.
Part II Dust Emission from Forming Galaxies
Dust Emission Model of Forming Galaxies 1. Model for dust production and radiation 1.1 Dust supply in young galaxies Dust formation in low-mass evolved stars (RGBs, AGBs, and SNe Ia) is negligible in a galaxy we consider here, because of the short timescale (age < 108 yr). Dust destruction can also be negligible by the same reason. We can safely assume that only SNe II contribute to the dust supply in young, forming galaxies. We solve the star formation, evolution of the strength of UV radiation field, metal enrichment, and dust production in a self-consistent manner.
1.2 Basic framework of our dust emission model Galaxy formation and evolution • Dust supply: Nozawa et al. (2003) • Star formation history: one-zone closed-box model with the Salpeter IMF (0.1 < M < 100 Msun). • Supernova rate: calculated from star formation rate Physics of dust grains • Optical properties of grains: Mie theory • Specific heat of grains: multidimensional Debye model • Radiative processes, especially stochastic heating of small grains are properly considered and included
A little more about Nozawa et al. (2003) Nozawa et al. (2003) proposed a theoretical model of dust formation by SNe II whose progenitors are initially metal-free. Two extreme scenarios are considered for the internal structure of the helium core of the SN progenitor. • Unmixed case: the original onion-like structure of the elements is preserved. • Mixed case: all the elements are uniformly mixed in the He core. We show the results for both cases in the following.
Construction of the SED • Spherical SF region with radius rSF surrounded by dust • Radiation field strength is calculated from LOB and rSF • LOB evolves according to the SF history. Based on the SFR and dust size spectrum, the total SED is constructed by a superposition of the radiation from each grain species. Considering the self-absorption by dust, the final SED is obtained as
2. Results Infrared SED (rSF=30pc, SFR=1.0Msunyr-1)
The extinction curve of forming galaxies Age t = 107yr. We will use these extinction curves also in Part III.
3. Observational Implications 3.1 A Local ‘Young Galaxy’ SBS 0335-052 Blue compact dwarf (BCD) Distance : 54 Mpc Very metal-poor : Z ~ 1/41 Zsun Very active star formation: SFR = 1.7 Msun yr-1 (Hunt et al. 2001) Very young stellar population: < 5 Myr (Vanzi et al. 2000) Very hot dust: Tdust > 80 K Very strong extinction: AV = 12-30 mag
Comparison of the models with the observed SED The observed dust SED is roughly reproduced by the model of unmixed case.
3.2 Quest for Forming Dusty Galaxies Typical physical parameters for high-z small galaxies If gas collapses on the free-fall timescale with a SF efficiency eSF (we assume eSF=0.1), SFR of a galaxy is basically evaluated as follows (Hirashita & Hunt 2004): If we consider a small clump with gas mass of 108 Msun and adopt rSF = 30pc and 100pc, we have a typical SFR of 10 Msunyr-1. We use these values for the estimation of dust emission from a genuine young galaxy.
ALMA detection limits (64 antennas, 8 hours). Herschel confusion limits by Lagache et al. (2003). Expected flux for a forming subgalactic clump at high-z
Natural huge telescope: gravitational lensing If we consider a strong gravitational lensing by a cluster at zlens=0.1–0.2with dynamical mass of 5×10¹⁴ Msun, it becomes feasible to detect such galaxies (magnification factor ~ 30–40). We can expect 1–5 events for each cluster at these redshifts.
Part III IR Absorption Line Measurement of H2 in the Early Galaxies
IR Absorption Line Measurement of H2 in the Early Galaxies 1. Basic Idea H2 molecules: the predominant constituent of dense gas. Local Universe Molecules containing heavy elements (e.g., CO, etc) are good tracers of the amount of H2. High-z systems in their first star formation They are very metal-poor, and we need a special technique for measuring the amount H2 directly..
Petitjean et al. (2000) and subsequent studies showed a direct measurement of H2 in UV absorption lines. Their target is damped Lyman-a absorbers (DLAs). Transition probability A of ionizing/dissociation lines is so large that they are useful for detecting thin layers and small amounts of the molecular gas, but not useful for detecting dense gas clouds, as those of our interest. Then, H2 has well-known vibrational and rotational transitions in the IR. Their transition probabilities are very small because the H2 is a diatomic molecule of two identical nuclei, and has no allowed dipole transitions. The vib-rotaional and rotational line emission of H2 are useful for analyzing dense (n > 10 cm-3) and hot (T > 300 K) gas.
Unfortunately, direct measurement of the H2 emission lines is very difficult for distant galaxies (Ciardi & Ferrara 2001). If, however, there is a strong IR continuum source behind or in the molecular gas cloud, absorption measurements of these transition lines can be possible (Shibai, Takeuchi, Rengarajan, & Hirashita 2001, PASJ, 53, 589)! Such observation will be feasible by the advent of the proposed space missions for large IR telescope, like SPICA, etc.
SPICA: One of the Observational Possibilities SPICA (Space Infrared Telescope for Cosmology and Astrophysics) is the next-generation IR mission, which is to be launched by the Japanese HIIA rocket into the L2 point. This mission is optimized for M- and FIR astronomy with a large (3.5 m), cooled (4.5 K) telescope. The target year of launch is 2010. http://www.ir.isas.jaxa.jp/SPICA/index.html
2. Calculation Assume a uniform cool gas cloud with kTex<<hn, then the optical thickness of the line absorption is expressed as where u and l: upper and lower states, gu and gl: degeneracy of each state, Aul: Einstein’s coefficient, Nl: column density of the molecules in the lower state, and DV: line width in units of velocity.
Assumption: almost all the molecules occupy the lowest energy state. Absorption line flux in the extinction free case is where Dn is a line width in units of frequency, S: continuum flux density of the IR source behind the cloud. Subscript 0 means extinction-free. We consider DV=100 kms-1 for the line, and S=10mJy as a baseline model. If the line optical thickness is smaller than 0.01, it is very difficult to detect. We therefore assume tline,0=0.01.
The dust extinction is introduced as where Al/AV: extinction curve, and AV/NH: normalization. We use the Galactic extinction (Mathis 1990) as a baseline model. We also see the effect of different extinction curves. The extinction scales with metallicity Z. Using this, absorption line flux with extinction is obtained as
Summary of the parameters for this calculation The detection limits is for SPICA (Ueno et al. 2000).
Considered hydrogen lines in the IR (Shibai et al. 2001, PASJ, 53, 589)
Z = 1 Zsun Z = 0.01 Zsun 3. Results 3.1 Absorption lines vs. dust extinction (metallicity) If the metallicity is one solar, we cannot detect these lines because of strong extinction. But if Z = 0.01 Zsun, they can be detected by SPICA.
3.2 Effect of extinction curve Solid line is the result for the Galactic extinction, while the dotted line is the mixed-case extinction curve, and dashed line is for the unmixed-case one. The result is sensitive to the extinction curve when the column density of the gas is high.
17, 28mm: IR 112mm: submm SPICA ALMA 3.3 Possible background source We consider QSOs, especially lensed ones. If we put some known QSOs at z=5, they have flux densities around 10mJy. Considering a 60K blackbody, 17, 28, and 112 mm lines will be suitable for this observation, but 2 mm line is hard to detect because of the weak continuum.
4. What can we learn? Consider a protogalactic cloud of M ~ 1011 Msun. Since the radius R is a few kpc in this case, we have its column density where f : gas mass fraction of molecular clouds. This fraction can be very high (~ 1) when NH is high enough (Hirashita & Ferrara 2005). Its evolution occurs in a free-fall timescale, much shorter than the cosmic evolution timescale, e.g., Hubble time. Observed properties are specific to the redshift at which the cloud absorption is measured.
We obtain z and DV (velocity dispersion) of primordial gas clouds from this observation. These quantities tell us their dynamical evolution through the structure formation theory. Collapse of a massive cloud (M ~1011Msun) at z<5: Basically observed in the IR, SPICA will be useful Population III objects (M ~ 106-9Msun) at z>5: Observed in the submm,ALMA will be required
1. Summary of dust emission model • We constructed a model for the SED of forming galaxies based on a new theory of dust production by SN II. • The model (unmixed case) roughly reproduced the observed SED of a local low-metallicity dwarf SBS0335-052, which has a peculiar strong and MIR-bright dust emission. • We also calculated the SED of a very high-z forming small galaxy. Although it may be intrinsically too faint to be detected even by ALMA, gravitational lensing can make it possible.
2. Summary of IR Absorption Measurement of H2 • We proposed a method to measure the amount of H2 in primordial low-metallicity cloud in absorption in an IR spectra of QSOs. • If the metallicity of the cloud is low (Z ~ 0.01 Zsun), dust extinction is expected to be so weak that 17 and 28mm lines are detectable by SPICA for objects at z <5. Small very high-z population III objects will be detected by ALMA. • By this method, we can trace back the dynamical evolution of early collapsing objects at very high redshifts.
Grain size spectrum of dust produced by SN II (Nozawa et al. 2003, ApJ, 598, 785)
Chemical evolution (a little more) Closed-box model is assumed. Time evolution of the mass of ISM where SFH is assumed to be constant, and we adopted Salpeter IMF Remnant mass (fitting formula)
Equivalent width of some IR lines The second line follows by the optically thin condition.
Herschel SPICA SPICA sensitivity