Download
1 / 27
270 likes | 390 Vues
An Analysis of Our C urrent T heory on Hurricane Formation. Compiled by Alex Letzo. The Currently Accepted Theory. From NOAA we have the standard meteorological theory for hurricane formation which states:

E N D
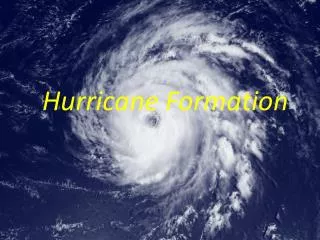
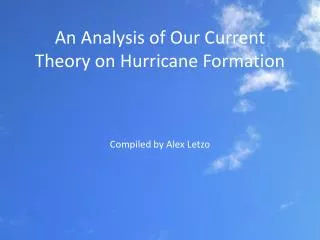
An Analysis of Our Current Theory on Hurricane Formation Compiled by Alex Letzo
The Currently Accepted Theory From NOAA we have the standard meteorological theory for hurricane formation which states: • In a mature hurricane, wind picks up warmth and moisture from the ocean, circling inward even faster from the outer cloud bands to the inner eye wall, where winds are the strongest and where it finally rises rapidly and is pushed out the top. • In the beginning a disturbance forms in the atmosphere, developing into an area of low atmospheric pressure. Winds begin to move into the center of the storm seedling from surrounding areas of higher air pressure. • Warm water heats the air and it rises as it nears the center.
Conservation of Energy Input: • Heat transferal from water that was warmed by the sun to the hurricane. Output: • Evaporation of water that we see in the clouds of the storm. • The maintaining of an extremely low atmospheric pressure in the eye of the hurricane.(Lowest measured in nature) • Movement across vast distances • Extreme electrical connections
Input Energy The energy gained from the warmth of oceans is easily calculated by measuring the sea surface temperature (SST) before a hurricane passes a point and immediately after. Thus we can see how much energy was absorbed by the storm system at a given point. Our observations will be based off of hurricane Irene due to the availability of SST data. The Equation: E = M * Cp* ΔT Where: E is the energy needed to change the temperature of a liquid. (Kilojoules) M is the mass of the object. (Kg) Cp is the specific heat index of the liquid. For water this is Cp= 4.19 kJ/Kg*C° ΔT is the difference in temperature of the liquid. (C°)
ΔT Clearly from the chart we see the difference in temperature on August 26th when hurricane Irene is at longitude=76.9 W and latitude=32.6 N we see a temperature difference of 29.4 C° - 27.45 C° = 1.95 C° = ΔT
Mass of Water • The mass of the water under the hurricane is given by Volume of Water(m3) * 1000 Kg/m3. Volume = π * radius(m)2 * Depth(m) = π * (466708.6 m)2 * (1 m) = 684292027300 m3 Mass = Volume * 1000 Kg/m3 = (684292027300 m3) * 1000 Kg/m3 = 684292027300000 Kg
Input Energy Calculation Energy = M * Cp* ΔT Where: M := Mass = 684292027300000 Kg Cp := Specific Heat = 4.19 kJ/Kg*C° ΔT := Difference in Temperature = 1.95 C° E = (684292027300000 Kg)(4.19 kJ/Kg*C°)(1.95 C°) = 5.591008009 x 10¹⁵ Kilojoules of Energy *Note: An atomic bomb has about 4.184 petajoules of energy (4.184 x 10¹⁵ Joules). We have here 5.59 quintillion Joules of energy (5.59 x 10¹⁸ Joules)
Output Energy First to consider is the energy output required for the evaporation of water that we see in the clouds of the storm. The energy required to evaporate water is referred to as the enthalpy of vaporization of water and is a function of temperature (C°). Energy (kJ) = The Enthalpy of Vaporization of Water Constant (kJ/Kg) * Mass of Water (Kg)
Vaporization of Water To estimate the mass of water that is evaporated we use Rohwer’s evaporation estimation formula that accounts for wind velocity: A = 0.771 ( 1.465 - 0.000732*Pa) ( 0.44 + 0.0733*U0) Where: A := Amount of Water Evaporated Pa := Atmospheric pressure in mm of mercury U0 := Wind velocity in Km/h
Estimate of Evaporation A = 0.771 ( 1.465 - 0.000732*Pa) ( 0.44 + 0.0733*U0) Where: A := Amount of Water Evaporated Pa := Atmospheric pressure in mm of mercury U0 := Wind velocity in Km/h (the radius of a hurricane is measured to where the winds no longer exceed 74 Miles/Hr. So we’ll use the radius of the hurricane and use a wind speed of 74 Miles/Hr for the wind velocity of the hurricane and clearly the actual amount of evaporation will be greater than our estimate which means it requires a larger amount of energy) A = 0.771(1.465 - .000732(706.558 mmHg)) (.44 + .0733(120.701 Km/h)) = 0.771 ( 0.947799544 ) ( 9.2873833 ) = 6.7868 mm = .0067868m
Energy of Evaporation Calculation Mass of the water evaporated: Mass = Amount of water evaporated * Area * 1000 Kg/m3 = (0.0067878 m) ( 684292027300 m2) ( 1000 Kg/m3) = 4.644144491 x 10¹² Kg At 27.4 C° the vaporization of water constant is 43.99 kJ/mol. 43.99 kJ/mol = 2.18217 kJ/g = 2182.17 kJ/Kg Energy (kJ) = Vaporization of Water Constant (kJ/Kg) * Mass of Water (Kg) = ( 2182.17 kJ/Kg ) (4.644144491 x 10¹² Kg) = 1.013432923 x 10¹⁶ Kilojoules of Energy
Atmospheric Low Pressure in the Eye P := Pressure P = Force/Area = Force*Distance /Area*Distance = Work / Volume The low pressure cell in the center of a hurricane is maintained while the area extending outside the eye wall to the edge of the hurricane is a high pressure cell. Thus a large amount of energy is expanded in order to maintain this low pressure. We calculate this energy by letting P be the difference in pressure between the High and the Low and solve for the energy. Volume of eye wall = π * radius(m)2 * Height(m) = π * (16093.4 m)2 * (14484.1 m) = 1.178520113 x 10¹³ m3 Energy =ΔP * Volume = ( 101325 Pa – 94200 Pa) * (1.178520113 x 10¹³ m3) = 8.396955807 x 10¹⁶ Joules = 8.396955807 x 10¹³Kilojoules of Energy
Energy of Motion We’ve already shown there is a significant energy source unexplained because the warm water doesn’t even explain for all the energy required to vaporize water. Thus the energy required for a hurricane to move at a given velocity will not be considered due to the fact that it is not a closed system and global air currents do play a role in the movement. However I would like to point out the there are cases where hurricanes do loops which the westerly trade wind could not possibly be the source of and therefore we can assume there is also a large amount of energy required to move the massive amounts of rain held in the cloud structure of hurricanes at various speeds.
Electrical Energy • The electrical energy can not be calculated but as with all storm systems it is present and does release enormous amounts of energy. • This trait of storms will be viewed in detail later.
Contradictions As with all theories, if there is a contradiction, your theory is disproven. So lets look in detail at some contradictions to our standard theory.
Mars Hurricane • Picture taken on April 27 shows a Martian polar storm more than 1,000 miles (1,600 km) across. The residual north polar water-ice cap is at top. • Clearly this is a hurricane due to the fact that we can noticeably distinguish an eye from space. • There is no warm water on Mars…and this is next to the polar ice cap.
Jupiter’s Hurricane Jupiter also has a hurricane although it is claimed that instead of warm water it is fueled by the internal heat of Jupiter.
Saturn’s Hurricane This is the largest hurricane we have discovered and is 5000 miles across and spins at a rate of 350 miles per hour. This storm has not yet been explained but scientist are looking into the eye of the storm for the possible cause.
Hurricane Sandy Hurricane Sandy gaining energy in the frigid North Atlantic waters at the beginning of winter.
Possible Explanations • To theorize about what could possibly be the source of energy for a hurricane we will have to look into all the traits a hurricane possesses and see which of the factors could explain what we observe in hurricanes.
Traits • Form over water in most circumstances or where there is an abundance of gas. • Symmetry and well defined structure. • Almost random movements. • Occurrence is unpredictable and because of this we use regression analysis to predict the hurricane seasons activity. • A central eye where we see the lowest natural atmospheric pressures present. • Different spins based on geological positioning (Coriolis Effect) • Periods where water is only being evaporated and clearly there are periods of rainfall. (Water accumulation is normally seen while the hurricane is in deep water and starts to dump rain once it nears a land mass) • Weakens over land • Immense electric output. ( Sprites and Elves )
Analyzing the Factors • None of the listed traits offer the abundance of energy we are looking for in order to explain all the we observe in a hurricane other than the electrical aspect. • The fact we witness immense electrical connections gives testimony to the idea that maybe this is the energy source of hurricanes and not the byproduct of some still unexplained reaction.
Electric Potential • The first thing that should be discussed relating to lightning and hurricanes is the observation of sprites and elves. • Sprites: are large-scale electrical discharges which occur high above a thunderstorm cloud. They normally are colored reddish-orange or greenish-blue, with hanging tendrils below and arcing branches above. They can also be preceded by a reddish halo(Elve). They often occur in clusters, lying 31 miles to 56 miles above the Earth's surface. • Elves:(Emissions of Light and Very Low Frequency Perturbations due to Electromagnetic Pulse Sources.) often appear as a dim, flattened, expanding glow around 250 miles in diameter that lasts for, typically, just one millisecond. They occur in the ionosphere 62 miles above the ground over thunderstorms. Their color was a puzzle for some time, but is now believed to be a red hue. • So clearly electricity is a huge part of storm systems and we have yet to address the topic and we can also assume if electricity is present in our atmosphere it is present in the atmospheres of Mars, Jupiter, and Saturn who also exhibit Hurricanes.
References • Principia Meteorologia The Physics of Sun Earth Weather By James McCanney • http://www.weather.com/newscenter/hurricanecentral/2011/irene.html • http://hyperphysics.phy-astr.gsu.edu/hbase/press.html • http://www2.bren.ucsb.edu/~dturney/WebResources_13/WaterSteamIceProperties/EnthalpyOfVaporizationH2O.pdf • http://www.nhc.noaa.gov/data/tcr/AL092011_Irene.pdf • http://nomads.ncdc.noaa.gov/las/getUI.do • http://www.springerreference.com/docs/html/chapterdbid/330823.html • http://theconstructor.org/water-resources/evaporation-and-its-measurement/4575/ • http://www.noaa.gov/images/Hurricane%20Irene%20by%20the%20Numbers%20-%20Factoids_V4_083111.pdf • http://www.simetric.co.uk/si_water.htm • http://www.engineeringtoolbox.com/heat-work-energy-d_292.html