Download
1 / 47
480 likes | 702 Vues
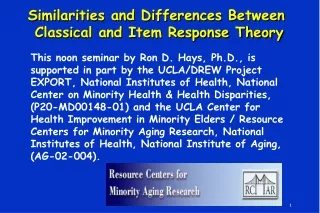
Similarities and Differences Between Classical and Item Response Theory.

E N D
Similarities and Differences Between Classical and Item Response Theory • This noon seminar by Ron D. Hays, Ph.D., is supported in part by the UCLA/DREW Project EXPORT, National Institutes of Health, National Center on Minority Health & Health Disparities, (P20-MD00148-01) and the UCLA Center for Health Improvement in Minority Elders / Resource Centers for Minority Aging Research, National Institutes of Health, National Institute of Aging, (AG-02-004).
Upcoming Conferences • October 17-19, Applications of Item Response Theory to Health. International Conference on Health Policy Research: Methodological Issues in Health Services and Outcomes Research, Chicago • Spring, 2004. NCI sponsored meeting, Improving the Measurement of Cancer Outcomes through the Applications of Item Response Theory (IRT) Modeling: Exploration of Item Banks and Computer-Adaptive Assessment. DC.
Reise and Henson (in press) Journal of Personality Assessment “The critical question is not whether IRT models are superior to CTT methods. Of course they are, in the same way that a modern CD player provides superior sound when compared to a 1960s LP player…The real question is, does application of IRT result in sufficient improvement in the quality of … measurement to justify the added complexity?” Reise & Henson, JPersonality Assessment, in press.
In the last 12 months, … 5. when you needed care from Dr. Shapiro for an illnessor injury, how often did you get care as soon as you wanted? 7. how often did you get an appointment with Dr. Shapiro for regular or routine health care as soon as you wanted? 9. when you called Dr. Shapiro’s office during regularoffice hours, how often did you get the help or advice you needed? 11. did the after hours care available to you from Dr. Shapiro meet your needs? Never, Sometimes, Usually, Always (5, 7, 9) No, Yes (11)
Basic Study Design • Patients were selected from physicians with at least 300 unique households with an encounter in the previous 12 months. • Patients were eligible if an adult member of 3 health plans or a large physician group in greater Cincinnati metro area and had at least one visit to one of the targeted physicians in the last 12 months. • 3,804 surveys completed (Xage = 48; 59% female); • n = 351 with complete data on 4 access items
Evaluating Multi-item Scales • Scale Characteristics • Reliability and unidimensionality • Distribution of scores (level on attribute) • Item Characteristics • Item difficulty • Item-scale correlation (“discrimination”)
Internal Consistency Reliability (alpha) Respondents 350 164.5 0.47 Items 3 11.88 3.96 Resp. x Items 1050 105 0.10 Total 1403 Source SS MS df 0.47 - 0.10 = 0.78 Alpha = 0.47
Standard Error of Measurement • SEM = S (1- reliability)1/2 • SEM = (.22)1/2 =0.46
(X - X) zX = SDX Person Score (level on attribute) • Average items together and compute z-score • Mean = 0, SD = 1, range: -2.07->0.83 • (-2.07;-1.34; -0.62; 0.11; 0.83)
Item difficulty (p = 0.84) • Proportion of people endorsing the item (p) can be expressed in z distribution form: • Z = ln (1-p)/p)/1.7 = (ln (1-p) – ln (p))/1.7 • = (ln (.16) – ln (.84))/1.7 • = (-1.83 + .17)/1.7 • = -1.66/1.7 • = -1.00 • (-2 -> 2 is typical range)
34% 50% -3 -2 -1 0 +1 +2 +3 P-value transformation for an Item (p=.84)
Item difficulty (5): p = 0.68 How often did you get illness or injury care as soon as you wanted? z = ln (1-p)/p)/1.7 = (ln (.32) – ln (.68))/1.7 = -0.43
Item difficulty (7): p = 0.61 How often did you get an appointment for regular or routine health care as soon as you wanted? z = ln (1-p)/p)/1.7 = (ln (.39) – ln (.61))/1.7 = -0.26
Item difficulty (9): p = 0.71 How often when you called did you get the help or advice you needed? z = (ln (1-p) – ln (p))/1.7 = (ln (.29) – ln (.71))/1.7 = -0.52
Item difficulty (11): p = 0.86 Did the after hours care meet your needs? z = ln (1-p)/p)/1.7 = (ln (.14) – ln (.86))/1.7 = -1.07
Item-Scale Correlations Item-scale correlation can be expressed in terms of z-statistic: - z = ½ [ln (1 + r) – ln (1-r) ] - if r = 0.30, z = 0.31 - if r = 0.80, z = 1.10 - if r = 0.95, z = 1.83
100 5, 23 15 1 4 17 11 16 80 29 25 26 19 8, 9 14 6 30 17 3 27 60 7 18 13 22 Difficulty (Percent Passing) 12 10 24 40 20 28 20 0 -.40 -.20 0 .20 .40 .60 .80 1.00 Discrimination (Item-Scale Correlation)
100 11 80 9 5 7 60 Difficulty (Percent Passing) 40 20 0 -.40 -.20 0 .20 .40 .60 .80 1.00 Discrimination (Item-Scale Correlation)
P(X1=0) 0 Item 1 Response P(X1=1) 1 P(X2=0) 0 Latent Trait Item 2 Response P(X2=1) 1 P(X3=0) 0 P(X3=1) Item 3 Response 1 P(X3=2) 2 Latent Trait and Item Responses
Person 1 Person 2 Person 3 Trait Continuum Item 1 Item 2 Item 3 Item Responses and Trait Levels
IRT Versus CTT • Item parameters (difficulty and discrimination) estimated using logistic models instead of proportions and item-scale correlations • Variety of IRT models • 1, 2, and 3 parameter models • Dichotomous and polytomous • Graded response, partial credit, rating scale
ai(q – bi) a = 2.20 a = 2.83 a = 1.11 b = -0.23 b = 0.25 b = 1.33 2-Parameter Logistic IRT Model Energetic Severe Fatigue q
IRT Versus CTT • Reliability (information) conditionalon underlying ability or attribute vs. • Reliability estimated overall
Information Conditional on Trait Level • Item information proportional to inverse of standard error of measurement: • Scale information is the sum over item information:
a = 2.83 a = 2.20 a = 1.11 b = -0.23 b = 0.25 b = 1.33 Item Information Curves(The range of the latent construct over which an item is most useful for distinguishing among respondents) I am too tired to do errands. I am too tired to eat I need to sleep during the day. Severe Fatigue Energetic
IRT Versus CTT • Item and person parameters incorporated into the same model. • Marginal maximum likelihood estimation (MML) used to calibrate item parameters • Level of attribute estimated by ML or Bayes methods rather than item sums
Scoring All Response Patterns Using Sum Score and Different IRT Models More Fatigued
IRT Strengths • CAT • Linking of scale • DIFF
IRT Versus CTT • Interest in person fit as well as item fit • ZL has expected value of zero, with variance of one (if person responds according to the estimated IRT model). Large negative ZL values (>= 2.0) indicate misfit. • Limited a lot in feeding, getting around, preparing meals, shopping, and climbing one flight of stairs; but limited a little in vigorous activities, walking one block, and walking more than a mile. • ZL = -9.56
Worthwhile URLs • http://appliedresearch.cancer.gov/areas/cognitive/immt.pdf • http://work.psych.uiuc.edu/irt/ • http://www.ssicentral.com/home.htm
Suggested Reading List • Embretson, S. E., & Reise, S. P. (2000). Item response theory for psychologists. New Jersey: Erlbaum. • Hambleton, R. K., & Swaminathan, H. (1985). Item response theory: Principles and applications. Boston: Kluwer-Nijhoff. • Hays, R. D., Morales, L. S., & Reise, S. P. (2000). Item response theory and health outcomes measurement in the 21st Century. Medical Care, 38, II-28-42. • Thissen, D., & Wainer, H. (eds.). Test scoring. New Jersey, Erlbaum.