Introduction to Logic Modeling Workshop
Introduction to Logic Modeling Workshop. National Environmental Partnership Summit May 8, 2006 Presented by: Yvonne M. Watson, Evaluation Support Division National Center for Environmental Innovation Office of Policy, Economics and Innovation U.S. Environmental Protection Agency.

Introduction to Logic Modeling Workshop
E N D
Presentation Transcript
Introduction to Logic Modeling Workshop National Environmental Partnership Summit May 8, 2006 Presented by: Yvonne M. Watson, Evaluation Support Division National Center for Environmental Innovation Office of Policy, Economics and Innovation U.S. Environmental Protection Agency
Presentation Goals • Enable participants to: • Understand key logic modeling, performance measurement and program evaluation terminology. • Learn how to develop a logic model for their programs in preparation for developing and refining meaningful performance measures and conducting program evaluations.
Session Agenda • Module 1: Developing a Logic Model • Module 2: Building on your Logic Models - The Bridge to Performance Measurement and Program Evaluation
Module 1: Developing a Logic Model
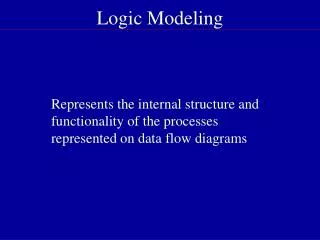
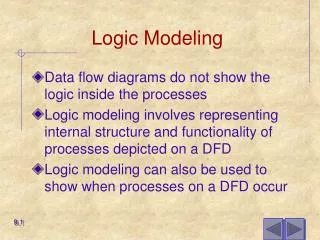
What is a Logic Model? To produce these outputs… So that these customers can change their ways… We use these resources… For these activities… Which leads to these outcomes… Leading to these results! A logic model is a diagram and text that describes/ illustrates the logical (causal) relationships among program elements and the problem to be solved, thus defining measurements of success.
Logic Model WHY HOW Longer term outcome (STRATEGIC AIM) Resources/ Inputs Activities Short term outcome Intermediate outcome Outputs Customers RESULTS FROM PROGRAM PROGRAM EXTERNAL CONDITIONS INFLUENCING PERFORMANCE (+/-)
Elements of the Logic Model WHY HOW Outcomes Resources/ Inputs: Programmatic investments available to support the program. Outputs Product or service delivery/ implementation targets you aim to produce. Short-term Changes in learning, knowledge, attitude, skills, understanding. Attitudes Long-term Change in condition. Condition Activities Things you do– activities you plan to conduct in your program. Customer User of the products/ services. Target audience the program is designed to reach. Inter-mediate Changes in behavior, practice or decisions. Behavior RESULTS FROM PROGRAM PROGRAM External Influences Factors outside of your control (positive or negative) that may influence the outcome and impact of your program/project.
5 Evaluation Support Division Staff Develop and deliver training material Program Evaluation Training materials EPA Managers and staff complete training EPA HQ and Regional Staff, States _____________ _____________ _____________ _____________ _____________ Types of Program Elements ExampleType of Program Element
Knowledge of program evaluation increased Customers equipped with skills to manage and conduct an evaluation Number of evaluations managed and conducted increased Program evaluation skills are used by customers in the work place Quality of evaluations managed and conducted is improved Evaluation culture is established at EPA __________________ __________________ __________________ __________________ __________________ __________________ Types of Program Elements ExampleType of Program Element
ESD TRAINING LOGIC MODEL ESD Training Goal: To provide training to enable our EPA partners to more effectively conduct and manage program evaluations and analyses and develop performance measures that can be used to improve their programs and demonstrate environmental results. Outcomes Resources Activities Outputs Customers Short-term Intermediate Long-term Strategic Plan · NCEI Staff · IAC Staff · PEN · PEC Winners · HQ/ Regional managers & staff ESD Staff: Y. Watson M. Mandolia J. Heffelfinger D. Bend C. Kakoyannis Access to: John McLaughlin · Knowledge of PE increased/ improved. · Customers equipped with skills to manage and conduct evaluations. · PE training materials. · Customers complete training. • PE skills are used by customers in the work environment • # of evaluations conducted and managed increased. Quality of evaluations managed and conducted is improved. Customers use program evaluation regularly and systematically to improve environmental programs in terms of: - environmental & health outcomes - reduced costs - cost effective-ness - EJ Benefits -Public Involvement - Efficiency · Develop and design PE, PM, IA and Logic Model curriculum and exercises. · Deliver PE, PM, IA and Logic Model training. · PM training materials. · Customers complete training. · Knowledge of PM increased/ improved. · Customers equipped with skills to develop measures. • PM skills are used by customers in the work environment. • # of staff developing measures is increased. Quality of measures developed and reported is improved. · NCEI Staff · SIG Recipients · HQ/ Regional managers & staff · States/Tribes · SBAP · CARE · IA training materials. · Customers complete training. · Logic Model training materials. · Customers complete training. • · Knowledge of Logic modeling increased/ improved. • · Customers equipped with skills to develop logic models of their programs. • Customers understanding of their programs is improved. Customers use logic models to help conduct evaluations and develop measures. Environ-mental programs more effectively achieve their strategic goals. · Provide technical assistance for workshop/ training attendees. • · Technical assistance delivered. · NCEI Staff · SIG Recipients · States · SBAP · CARE Partners Partners deliver PE, PM and Logic model training to their clients/ customers. • · Facilitate Train the trainer sessions for PE, PM and Logic Modeling. • · Partners complete training. OCFO OW OSWER ORD OARM OCFO, OW, OSWER, ORD, OARM • · Provide guidance for Environmental Results Grants Training. EPA Project Officers & Grant Managers EPA POs & GMs recognize outputs/ outcomes in grant proposals • · Environmental Results Grants Training materials.
What are Logic Models Used For? • Staff and managers can use logic models to… • Develop program/project design • Identify and develop performance measures for their program/project • Support strategic planning • Communicate the priorities of the program/project • Focus on key evaluation questions
Benefits of Logic Modeling • Illustrates the logic or theory of the program or project. • Focuses attention on the most important connections between actions and results. • Builds a common understanding among staff and with stakeholders. • Helps staff “manage for results” and informs program design. • Finds “gaps” in the logic of a program and work to resolve them.
Steps in the Logic Model Process • Establish a team or work group and collect documents. • Define the problem and context for the program or project and determine what aspect of your program/project you will logic model. • Define the elements of the program in a table. • Verify the logic table with stakeholders. • Develop a diagram and text describing logical relationships. • Verify the Logic Model with stakeholders. Then use the Logic Model to identify and confirm performance measures and in planning and evaluation.
Step 1. Establish a team/workgroup and collect documents and information • Convene/consult a team/workgroup • Provides different perspectives and knowledge • Attempts agreement on program performance expectations • Review sources of program or project documentation • Strategic and operational plans • Budget requests • Current metrics • Past evaluations • Conduct interviews of appropriate staff
Step 2. Define the problem the program addresses and the context the program operates in • Problem or Issue Statement: What is the problem (s) the program/project is attempting to solve or the issue (s) the program/project will address? • Community Needs: What is the specific need of the community the program is attempting address? • Program Niche: What assets or activities make your organization uniquely qualified to address the problem? • Context/External Factors: Are there factors outside of your control (positive or negative) that may influence the outcome and impact of your program/project? What are the drivers of success and constraints on success? • Assumptions: State the assumptions behind how and why you believe your approach to address the problem will work.
Step 2. Define the problem the program addresses and the context the program operates in Problem Poor quality of performance measures developed and insufficient number and quality of evaluations conducted at EPA resulting in program inefficiencies, ineffectiveness and inability to achieve strategic goals. Program Niche Evaluation Support Division provides Logic Modeling, Measurement and Evaluation Training, Technical Assistance and Train-the-Trainer Sessions Community Need $$ and skills to develop measures and conduct evaluations • Outcomes • Quality of evaluations managed and conducted is improved. • Quality of measures developed and reported is improved. • Customers use evaluation and measurement regularly and systematically to improve environmental programs. • Environmental programs more effectively achieve their strategic goals. External Factors Drivers of success: GPRA, PART, Grants Order 5700.7 Constraints on success: FTE & $$ Assumptions Target audience uses measurement and evaluation skills
Step 3. Define the elements of the program or project in a table WHAT and WHY - HOW - WHO Outcomes Resources/ Inputs Long-term (change in condition) Intermediate (Change in behavior) Short-term (change in attitude) Customers reached Activities Outputs Program outcomes related to factor(s) External Influences:
Step 4. Verify the logic table with stakeholders Outcomes Resources/ Inputs 5 ESD Staff $65K Extramural funds Outside Consultant Customers Reached NCEI Staff IAC Staff PEN PEC 04’ OSWER OW States HQ/Regional managers & staff Short-term (Change in Attitude) Knowledge of program evaluation increased. Customers equipped with skills to manage and conduct evaluations. Long-term (Change in Condition) Evaluation culture established. Quality of evaluations managed and conducted is improved. Activities Develop training materials. Deliver training. Outputs PE training materials EPA managers and staff complete training. Innovation training materials. Intermediate (Change in Behavior) Number of evaluations conducted and managed increased. Program evaluation skills are used by customers in the work environment. ESD example External Influences: Reduction in budget available to provide training to customers.
Step 5. Develop a diagram and text describing logical relationships We use these resources… For these activities… To produce these outputs… So that these customers can change their ways… Which leads to these outcomes… Leading to these results! • Draw arrows to indicate/link the causal relationships between the logic model elements. • Limit the number of arrows. Show only the most critical feedback loops. • Work from both directions (right-to-left and left-to-right): • Ask “How-Why” questions: • Start with Outcomes and ask “How?” • Start at Activities and ask “Why?” • Ask “If-Then” questions: • Start at Activities and move along to Outcomes asking, “If this, then that?”
Step 6. Verify logic with stakeholders • Seek review from the same, or an even broader, group of stakeholders. • Compare to what units in the organization do and define their contributions to the outcomes. • Check the logic by checking it against reality.
Questions to Verify Your Logic Model • Is the program’s outcome structure described and is it logical? • Are the outcomes in the right order making clear the cause-effect relationship between outcomes? • If the short-term (first order) outcomes are achieved, will they lead to, in part, achieving the intermediate (second order) outcomes? • What else, if anything has to happen to enable the full realization of the intermediate outcomes? • If the intermediate outcomes are achieved, will they result in predicted changes in the long-term (third order) outcomes? • What else, if anything has to happen to enable the full realization of the longer-term outcomes?
Questions to Verify Your Logic Model • Are the program’s customers described and are they the right customers, given the outcomes? • Are there other customers that need to be reached if the outcomes (short-term, intermediate, or longer-term) are to be achieved? • Are the program’s major resources, processes, and outputs described and are they logically consistent and sufficient to achieve outcomes? • Could activities be consolidated into strategies to make the presentation more clear? • Are the program’s partners and external factors described?
ORD Is Developing Outcome-Oriented Performance Indicators Programs are implemented & managed from LEFT to RIGHT Research Program Clients Results Research Activities Effective Transfer Specific Clients Long-Term Outcomes Resources Research Outputs Short-Term Outcomes Intermediate Outcomes Strategic Objectives Annual Performance Measures Strategic Goals 1. We use resources ($, FTE, & infrastructure), partnerships, and guidance from stakeholders … 2. …to coordinate and conduct the research, development, & administrative activities that will be needed to answer key research questions, and … 3. … to create the research knowledge, tools, processes, technologies etc. and the key outputs that must be developed over time … 4. … for intended clients (such as senior scientists or decision makers in government, the regulated community, or the public) … … 5. … and to prepare for the effective transfer of key research outputs that will lead to . . . 7.…resulting in changes in client decisions or actions … 6. client reactions and to changes in knowledge, attitudes, skills, or aspirations ... 9. to demonstrate measurable long-term improvements in human or ecosystem health 8. . ... which contribute to measurable changes in environmental contaminants, stressors, or exposures… Performance Goals * *Please note that Performance Goals include key research outputs, a synthesis product, & plans for effective transfer to intended clients to bring about short-term outcomes. The synthesis product addresses and serves to answer a key research question linked to outcomes, and compares the accomplishment represented by the Performance Goal to baseline conditions and to related goals in future years needed to achieve outcomes.
External influences affecting program effectiveness: • Absence of a strong drinking water regulatory framework • Strict two-year timeline • Occurrence of natural disasters Logic Model: Laboratory-Strengthening Component of EPA’s Safe Drinking Water Program in Central America Mission: Improve drinking water quality by strengthening the capacity of institutions responsible for providing safe drinking water to produce data of known quality in targeted rural and key urban/periurban areas of El Salvador, Nicaragua, and Honduras. Short-term outcomes Intermediate outcomes Long-term outcomes Resources Activities Outputs Customers Reliable analytical data is produced by laboratories Assess laboratory capabilities and training and equipment needs Reports on training and equipment needs • EPA • OIA • ORD • OW • R2 • R9 • R10 Water professionals have increased knowledge of standard operating procedures for data handling, analysis and equipment use Laboratory water professionals& personnel Training workshops conducted Training and reference materials in Spanish Increased number of laboratories achieve accreditation Develop and deliver comprehensive laboratory training courses and reference materials Partners • In-country water utilities • Pan American Health Orgs • Ministries of Health (MOH) • USAID Water quality decision-makers (such as in MOH) Water quality decision-makers view analytical lab data more favorably Quality analytical data is used to make decisions and enforce environmental laws Improved drinking water quality Procure and deliver laboratory equipment to MOH and water labs Laboratory equipment delivered
Short-Term Long-Term RCRA Recycling Logic Model Resources Activities Outputs Customers Promulgate Rulemaking Staff $ Regions States Trade Associations Individual Companies OGC/ OECA Rules Generators Recyclers States Policy Interpretation Guidance Letters DSW Network Calls & Website Outreach States/Regions Outcomes Awareness by industry Exclusion is available Relevant states pick up rule Regions authorize states for rule Awareness of Rule (states & industry) Less haz waste Better env’t & healthy public Increased recycling (desire to recycle and capacity) Favorable change in recycling costs Firm(s) lobby state to pick up rule Conserve resources Change in stigma External: market forces (T&D costs), number of recyclers, markets for recycled products, technology, bureaucratic process, politics, state budgets, PR, public goodwill
ESD TRAINING LOGIC MODEL ESD Training Goal: To provide training to enable our EPA partners to more effectively conduct and manage program evaluations and analyses and develop performance measures that can be used to improve their programs and demonstrate environmental results. Outcomes Resources Activities Outputs Customers Short-term Intermediate Long-term Strategic Plan · NCEI Staff · IAC Staff · PEN · PEC Winners · HQ/ Regional managers & staff ESD Staff: Y. Watson M. Mandolia J. Heffelfinger D. Bend C. Kakoyannis Access to: John McLaughlin · Knowledge of PE increased/ improved. · Customers equipped with skills to manage and conduct evaluations. · PE training materials. · Customers complete training. • PE skills are used by customers in the work environment • # of evaluations conducted and managed increased. Quality of evaluations managed and conducted is improved. Customers use program evaluation regularly and systematically to improve environmental programs in terms of: - environmental & health outcomes - reduced costs - cost effective-ness - EJ Benefits -Public Involvement - Efficiency · Develop and design PE, PM, IA and Logic Model curriculum and exercises. · Deliver PE, PM, IA and Logic Model training. · PM training materials. · Customers complete training. · Knowledge of PM increased/ improved. · Customers equipped with skills to develop measures. • PM skills are used by customers in the work environment. • # of staff developing measures is increased. Quality of measures developed and reported is improved. · NCEI Staff · SIG Recipients · HQ/ Regional managers & staff · States/Tribes · SBAP · CARE · IA training materials. · Customers complete training. · Logic Model training materials. · Customers complete training. • · Knowledge of Logic modeling increased/ improved. • · Customers equipped with skills to develop logic models of their programs. • Customers understanding of their programs is improved. Customers use logic models to help conduct evaluations and develop measures. Environ-mental programs more effectively achieve their strategic goals. · Provide technical assistance for workshop/ training attendees. • · Technical assistance delivered. · NCEI Staff · SIG Recipients · States · SBAP · CARE Partners Partners deliver PE, PM and Logic model training to their clients/ customers. • · Facilitate Train the trainer sessions for PE, PM and Logic Modeling. • · Partners complete training. OCFO OW OSWER ORD OARM OCFO, OW, OSWER, ORD, OARM • · Provide guidance for Environmental Results Grants Training. EPA Project Officers & Grant Managers EPA POs & GMs recognize outputs/ outcomes in grant proposals • · Environmental Results Grants Training materials.
“Z” Logic Strategic Program Results C Outcomes Resources Action C A Outputs Action A Resources B Outputs Resources Action B
Energy R,D,&D Program Using ‘Z’ Logic For Customers Short-term outcomes Intermediate outcomes Long-term outcomes Resources Activities Outputs Program $, Staff Ideas for technology change For industry researchers Leads to applications in energy technologies Potential for technology change documented Perform research Added resources Lab prototype report For users and Manufacturers Leads to commercial prototype Technology available for commercialization Develop technology Leads to knowledge, less risk perceived Added resources Policies, incentives, information Early adopters express desire to buy Deploy technology For users and Manufacturers (Shared responsibility) Produce technology & educate market Manufacture the technology in market Leads to technology accepted, purchased Consequences of use- Lower energy costs and emissions Competitive economy, cleaner environment Commercial $, Staff For buyers of that technology External Influences: Price of oil and electricity, economic growth in industry and in general, perception of risk of global climate change and need for national energy security, market and technology assumptions. Source: McLaughlin and Jordan, 1999
Exercise 1: Logic Modeling Brief application of logic modeling
Exercise 2: Logic Modeling Developing your own logic model
Module 2: Building on Your Logic Model – The Bridge to Performance Measurement and Program Evaluation
Drivers for Performance Measurement and Program Evaluation • Good Program Management. • Government Performance and Results Act (GPRA) of 1993 • Requires EPA to report schedules for and summaries of program evaluations that have been or will be conducted and identify those that influence development of the Agency’s Strategic Plan. • OMB’s Program Assessment Rating Tool (PART) • Tool designed to assess and evaluate programs across the government (40 EPA programs scheduled for PART assessment through 2008). • Environmental Results Order 5700.7 • Requires EPA grant officers and grant recipients to identify outputs and outcomes from grants and connect them to EPA’s strategic plan.
Definitions Performance Measurement: The ongoing monitoring and reporting of program progress and accomplishments, using pre-selected performance measures. • Performance measure – a metric used to gauge program or project performance. • Indicators – measures, usually quantitative, that provide information on program performance and evidence of a change in the “state or condition” in the system.
Definitions Program Evaluation: • A systematic study that uses measurement and analysis to answer specific questions about how well a program is working to achieve its outcomes and why. • Consists of various activities: • Needs assessment • Design assessment • Process/Implementation • Evaluability assessment • Outcome and Impact
Orientation/Approaches to Measurement and Evaluation • Program Evaluation Orientation • Accountability (Audit) or • Learning & Program Improvement • What outcomes have been achieved and why? • What aspects of my program lead to these outcomes? • What roles did context play in my outcomes? • Performance Measurement Orientation • Accountability
Performance Measurement Ongoing monitoring and reporting of accomplishments. Examines achievement of program objectives. Describes program achievements in terms of outputs, outcomes in a given time against a pre-established goal. Early warning to management. Program Evaluation In-depth, systematic study conducted periodically or on ad-hoc basis. Examines broader range of information on program performance than is feasible to monitor on an on-going basis. Explains why the results occurred. Longer term review of effectiveness. Differences between Measurement and Evaluation
Relationship between Measurement and Evaluation • Performance measurement data provides information needed to conduct the evaluation and assess program performance. • Lack of performance measurement data is a major obstacle to conducting an evaluation.
What can Measurement and Evaluation do for you? • Ensure program goals & objectives are being met. • Determine if allocated resources are yielding the greatest environmental benefit. • Identify what works well, what does not and why. • Identify program areas that need improvement.
Logic Model WHY HOW Longer term outcome (STRATEGIC AIM) Resources/ Inputs Activities Short term outcome Intermediate outcome Outputs Customers RESULTS FROM PROGRAM PROGRAM EXTERNAL CONDITIONS INFLUENCING PERFORMANCE (+/-)
ESD Training Performance Measures Logic Model Elements Example Measures
Types of Evaluation Questions as they Fit into the Logic Model HOW WHY Longer term Short term Intermediate outcome Activities Outputs Customers Resources/ Inputs outcome outcome (STRATEGIC AIM) Outcomes Impact NEEDS Process Evaluation Dialogue Between OMB and Federal Evaluation Leaders: Digging a Bit Deeper into Evaluation Science, April 2005
Common Evaluation Questions Asked at Different Stages of Program Development Adapted from Evaluation Dialogue Between OMB and Federal Evaluation Leaders: Digging a Bit Deeper into Evaluation Science, April 2005
Contacts Yvonne M. Watson Evaluation Support Division National Center for Environmental Information U.S. Environmental Protection Agency (202) 566-2339 watson.yvonne@epa.gov