
Uploaded by
arwen
3 SLIDES
168 VUES
30LIKES
Visualizing Project Management Through Use Case Diagrams and Gantt Charts
DESCRIPTION
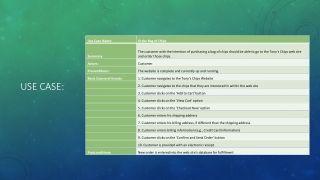
This guide explores the integration of Use Case Diagrams and Gantt Charts in project management. Use Case Diagrams help illustrate system functionalities and user interactions, while Gantt Charts provide a visual timeline for project tasks. Together, these tools enhance understanding and streamline project workflows, ensuring efficient communication among stakeholders. Whether you're managing software development, event planning, or any project-based work, leveraging these diagrams can significantly improve organization and clarity throughout the project lifecycle.
Download
1 / 3
Télécharger la présentation 
Visualizing Project Management Through Use Case Diagrams and Gantt Charts
An Image/Link below is provided (as is) to download presentation
Download Policy: Content on the Website is provided to you AS IS for your information and personal use and may not be sold / licensed / shared on other websites without getting consent from its author.
Content is provided to you AS IS for your information and personal use only.
Download presentation by click this link.
While downloading, if for some reason you are not able to download a presentation, the publisher may have deleted the file from their server.
During download, if you can't get a presentation, the file might be deleted by the publisher.
E N D


![External Website Hosting Business Case [Free Template]](https://cdn4.slideserve.com/7373913/slide1-dt.jpg)
More Related