Evolution of Star Formation Rate Density with Redshift and Key High-z Galaxy Populations
This study reviews the evolution of star formation rate (SFR) density from z

Evolution of Star Formation Rate Density with Redshift and Key High-z Galaxy Populations
E N D
Presentation Transcript
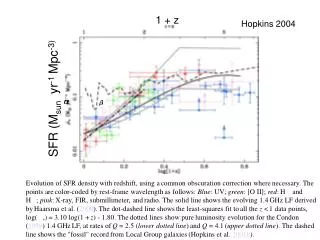
1 + z Hopkins 2004 SFR (Msun yr-1 Mpc-3) Evolution of SFR densitywith redshift, using acommon obscuration correction wherenecessary. The points arecolor-coded by rest-frame wavelengthas follows: Blue: UV;green: [O II]; red:H and H ; pink:X-ray, FIR, submillimeter, andradio. The solid lineshows the evolving 1.4GHz LF derived byHaarsma et al. (2000).The dot-dashed line showsthe least-squares fit toall the z <1 data points, log( *)= 3.10 log(1 +z) - 1.80. Thedotted lines show pureluminosity evolution for theCondon (1989) 1.4 GHzLF, at rates ofQ = 2.5 (lower dotted line)and Q = 4.1(upper dotted line). The dashed lineshows the "fossil" recordfrom Local Group galaxies(Hopkins et al. 2001b).
Importance of High z Data Now introduce three key 1 < z < 4 galaxy populations whose studies are relevant to addressing these issues – complementary!! I: Lyman break galaxies: color-selected luminous star forming galaxies z > 2 II: Sub-mm galaxies located via redshifted dust emission III: Various categories of “passively-evolving” sources whose selection has been enabled via deep IR data (BETTER: DRG=Distant Red Galaxies, or EROs = Extremely Red Objects) (TABELLA -- say ARAA)
Finding star-forming galaxies at high z The Lyman continuum discontinuity is particularly powerful for isolating star-forming high redshift galaxies. From the ground, we have access to the redshift range z=2.5-6 in the 0.3-1 micron range. Steidel et al 1999 Ap J 462, L17 Steidel et al 1999 Ap J 519, 1 Steidel et al 2003 Ap J 592 728
High-z example: Lyman break galaxies (U-band dropouts) Photometrically selected using rest frame UV colors – originally, z=2.7-3.4 (list of bands) Steidel et al. 2003
Photometric Cuts: Prediction and Practice Real Data (10’ field) Expectations Spectral energy distributions allow us to predict where distant SF galaxies lie in color-color diagrams such as (U-G vs G-R) (Steidel et al 1996)
Most well studied high-z galaxies: Lyman break galaxies (U-band dropouts) Dark shaded: SFR calculated from UV luminosities without any dust correction Light blue: Corrected for dust assuming a continuous SF with age T=0.1Gyr and using the starburst obscuration law (E(B-V) derived from comparison observed and predicted colors Light shaded: Corrected for dust fitting broad-band photometry (UV to optical) with specphot. Models) Giavalisco ARAA 2002
HST images of spectroscopically-confirmed “Lyman break” galaxies with z>2 in Hubble Deep Field North revealing small physical scale-lengths and irregular morphologies Giavalisco et al 1996 Ap J 470, 189
Extending the Technique 1 < z < 4 Lyman break Balmer break
BEST INDICATOR IN THE OPTICAL: THE Hα LINE (6563 A) IN EMISSION Elliptical Sa Sc Sm/Irr Kennicutt 1992
THE ULTRAVOLET EMISSION AS INDICATOR OF ONGOING AND RECENT STAR FORMATION Leitherer and collaborators – STARBURST99
Extending the Technique 1 < z < 4 Lyman break Balmer break
Sub-mm Star Forming Sources 15m JCMT SCUBA array Sub-mm astronomers SCUBA: 850m array detects dusty star forming sources: - behind lensing clusters (Smail et al Ap J 490, L5, 1997) - in blind surveys (Hughes et al Nature 394, 211, 1998) Source density implies 3 dex excess over no evolution model based on density of local IRAS sources: Key question is what is the typical redshift, luminosity and SF rate?
SUBMILLIMITER OBSERVATIONS Sampling the IR emission with 850micron fluxes (e.g. Hughes et al. 1998) – Dust heated by either star formation or an active nucleus Negative K-corrections – the flux density of a galaxy at ~800micron with fixed intrinsic luminosity is expected to be roughly constant at all redshifts 1 < z < 10 While the Lyman break technique prefentially selects UV-bright starbursts, the submillimiter emission best identifies IR luminous starbursts. The approaches are complementary (debated relation between the two poulations).
Radio Identification of Sub-mm Sources SCUBA sources often have no clear optical counterpart, so search with VLA & OVRO L ~ 1013 L if z~2 Could be as important as the UV Lyman break population Frayer et al (2000) AJ 120, 1668
Redshifts for radio-selected SCUBA sources • VLA positions for 70% of f(850m) > 5 mJy (20% b/g) • Slits placed on radio positions (22 < I < 26.5) with Keck • 10-fold increase in number of SCUBA redshifts (LRIS-B) Chapman et al (2003) Nature 422, 695 Chapman et al (2005) Ap J 622, 722
Sub-mm and Lyman break galaxies coeval 2003 2005 • Most sub-mm sources have z < 4 • Peak z = 2.4 – comparable to that for AGN • Although (LBG) 10 (SCUBA), luminosity/SF densities comparable: significant contribution to the star formation at high redshift • Progenitors of ellipticals?
“Passively-Evolving” Sources(wrong name!!!) • LBGs and sub-mm are both star forming sources • Arrival of panoramic IR cameras opens possibility of locating non-SF (or dusty) galaxies at high z • Termed variously: • Extremely Red Objects • Distant Red Galaxies • depending on selection criterion (see McCarthy 2004 ARAA). for z ~ 1-2: select on I-H colour for z > 2: select on J-K colour Such objects would not be seen in the Lyman break samples
FIRES – VLT+ISAAC 176 hours J,H,K imaging MS1054-03 N. Forster-Schreiber et al. 5.4’ x 5.4’, seeing 0’’45 HDF South I. Labbe et al. 2.4’ x 2.4’, seeing 0’’45
“Passively-Evolving” Sources(wrong name!!!) • LBGs and sub-mm are both star forming sources • Arrival of panoramic IR cameras opens possibility of locating non-SF (or dusty) galaxies at high z • Termed variously: • Extremely Red Objects • Distant Red Galaxies • depending on selection criterion (see McCarthy 2004 ARAA). for z ~ 1-2: select on I-H colour for z > 2: select on J-K colour Such objects would not be seen in the Lyman break samples
BEST INDICATOR IN THE OPTICAL: THE Hα LINE (6563 A) IN EMISSION Elliptical Sa Sc Sm/Irr Kennicutt 1992
THE ULTRAVOLET EMISSION AS INDICATOR OF ONGOING AND RECENT STAR FORMATION Leitherer and collaborators – STARBURST99
Spectroscopy: not passively evolving!! Z=2.43 Z=2.43 Z=2.43 Z=2.71 Z=3.52
Objects with J-K > 2.3 Surprisingly high surface density: • ~0.8/arcmin to K=21 (two fields) • ~2/arcmin to K=22 (HDF-S) • ~3/arcmin to K=23 (HDF-S) 2 2 2 2 van Dokkum,Franx, Rix et al
Towards a Unified View of the Various High z Populations • Integrating to produce a comoving cosmic SFH dodges the important question of the physical relevance of the seemingly diverse categories of high z galaxies (e.g. LBGs, sub-mm, DRGs). • Given they co-exist at 1<z<3 what is the relationship between these objects? • Key variables: • - basic physical properties (masses, SFRs, ages etc) • relative contributions to SF rate at a given redshift • degree of overlap (e.g. how many sub-mm sources are LBGs etc) • spatial clustering Some recent articles: Papovich et al (2006) Reddy et al (2005)
Lyman Break Galaxies - Clustering UV bright galaxies at z~3 are clustered nearly as strongly as bright galaxies in the present Universe. Of what population are they the progenitors? What are the masses of these galaxies (both dark and stellar)? Adelberger et al (1998) demonstrated strong clustering of LBGs consistent with their hosting massive DM halos perhaps as progenitors of massive ellipticals (Baugh et al 1998)
V-band Luminosity Function at z~3 Local LF • Key to physical nature of LBGs is origin of intense SF. Is it: • prolonged due to formation at z~3 (Baugh et al 1998) • temporary due to merger-induced star burst (Somerville et al 2001) Shapley et al 2001 Ap J 562, 95
LBG Properties (z~3) <M*> = ~2 x 10¹⁰ M <age> = 320 Myr @ z = 3 <SFR> ~ 45 M yr-1 <E(B-V)> =0.15 AUV~1.7 ~5 Extinction correlates with age– young galaxies are much dustier SFR for youngest galaxies average 275 M yr-1 ; oldest average 30 M yr-1 Objects with the highest SFRs are the dustiest objects Shapley et al 2001 Ap J 562, 95
Composite Spectra: Young vs. Old • Young LBGs also have much weaker Ly emission, stronger interstellar absorption lines and redder spectral continua • Galaxy-scale outflows (“superwinds”), with velocities ~500 kms s-1, are present in essentially every case examined in sufficient detail
LBG Summary • Period of elevated star formation (~100’s M yr-1) for ~50 Myr with large dust opacity (sub-mm galaxy overlap) • Superwinds drive out both gas and dust, resulting in more quiescent star formation (10’s M yr-1) and smaller UV extinction • Quiescent star formation phase lasts for at least a few hundred Myr; by end at least a few 1010 M of stars have formed So how is this LBG-submm connection viewed from the sub-mm point of view?
Clustering allows us to determine the typical halo mass in which different galaxy types live What about clustering of sub-mm sources? Correlation length r0 Evidence for stronger clustering than LBGs (though N=73 cf. N>1000 LBGs) suggesting more massive subset in dense structures Blain et al 2004 Ap J 611, 725
`BzK’ selection of passive and SF z>1.4 galaxies New apparently less-biased technique for finding all galaxies 1.4<z<2.5 sBzK: star forming galaxies pBzK: quiescent galaxies (z-K) (B-z) WHERE DO THESE FIT IN? Daddi et al 2004 Ap J 617, 746
LBG & `BzK/SF’ z~2 populations are the same? LBG Contribution to SF density Fraction of BzK/SF galaxies selected as LBGs and v.v. (including X-ray AGN) (excluding X-ray AGN) Reddy et al 2005 Ap J 633, 248
Stellar mass Specific SFR (/mass) Spitzer Studies of Massive Red Galaxies (J-K>2.3) K-selected sample of 153 DRGs z<3; many with M>1011 M; 25% with AGN Specific SFR (including IR dust emission) ~2.4 Gyr-1; >> than for z<1 galaxies Witnessing bulk of SF in massive galaxies over 1.5<z<3 Papovich et al 2006
Hopkins & Beacom (2006) – at z<1, SF density goes as (1+z)3.1 Fitting parametric SFH can predict * (z) in absolute units Implications of Cosmic SFH Mass assembly history Star formation history Cole et al 2dF GALEX, SDSS UV ACS dropouts Spitzer FIR • Satisfactory agreement with local 2dF/2MASS mass density • Data suggests half the local mass in stars is in place at z~2 0.2 • Major uncertainties are IMF and luminosity-dependent extinction