Download
1 / 45
450 likes | 508 Vues
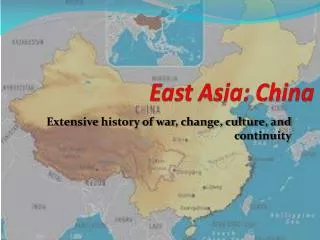
Explore the evolution of statistics education in China, focusing on teacher practices and the incorporation of statistical content in the national curriculum. Discover case studies, comparisons with other countries, and the importance of technology in statistical education. Learn how statistical thinking is crucial for students in the modern world.

E N D
Enhancing Chinese Math Teachers' Statistical Teaching practices:Inspiration from My Visiting Experience Ruijie He East China Normal University NCSU Advisor: Hollylynne Lee
System of Chinese Regular Education Governmentof China(1954,1985,1993)
ChineseSecondarySchool Class size in Shanghai MOE,2017
ChineseSecondarySchool Office of Subject Group
Subjects of Secondary School Ministry of Education of China(2011,2017)
Math Education in China Mathematics curriculum standards, formulatedby MOE 2011 and 2017.
Statistics Content in High School • 1. Data collection: statistical statement and yearbook, survey, experiment, census, sampling and internet; population, sample, sample size, randomness of data • 2. Sampling: simple random sampling, stratified random sampling, choice of sampling method • 3. Graph and table: • 4. Sampling and population: central tendency(mean, median, mode), dispersed tendency(standard deviation, variance, range), sampling distribution, percentiles Ministry of Education of China(2017)
Math Education in China • In Gaokao mathematics, points of probability and statistics also occupies a small proportion. There are totally 150 points of whole mathematics examination of Gaokao, for most years, probability and statistics only occupies 12 points, which is a question need answer process. In most situation, this question is about probability and mathematical expectation.
Examples of Gaokao Mathematicsof Statistics • (2007)(12pts) Purchasing an insurance,a policyholder should pay ato insurance company, if the policyholder need compensation, the holder could get 10000. Supposing there is 10000 people purchase this insurance one year, and the compensations of everyone are individually. We know the probability that the insurance company to pay at least 10000in compensation within one year is1-0.99910000 . • 1)What is the probability that one policyholder need compensation within one year. • 2) Besidesthecompensation, the cost of the company to sell this insurance is 50000 . For ensure the expected value of profit is positive, how much should every policyholder pay at least.
Examples of Gaokao Mathematicsof Statistics (2)In one day‘s inspection, if there appears a component which size is beyond (μ-3σ,μ+3σ) , it will be considered unnormal, need to recheck the produce process.Explain the rationality of the above method.
Math Education in China and Stat Content • The low proportion of statistics in Gaokao and textbook make math teachers think this part is not important as other contents. • Traditional teaching method make them teach statistics as other mathematics content, pay more attention on remembering definition and formula, practicing on computing skills. • Many teachers also think statistics is a branch of mathematics. • Most teachers do not use technology, a few teachers only use Excel to do statistics. Almost teachers cannot use the dynamic statistics software.
Math Education in China and Stat Content • Recently, there are more researches of statistics education in China. But most of these research are concerns on the statistics contents in textbooks, national curriculum and examinations. Such as: The Comparative Study of Statistics and Probability in High School Mathematics Textbooks between China and Australia. The Comparison on the Standard of Statistic andProbabilityContent in Mathematics Curriculum of Senior High Schoolsbetween China and America.
Math Education in China and Stat Content • Other researches about statistics education concerns on how teachers teach. Such as: Case Study of the Quality of High School Statistics Instruction. Study on the Teaching of the Statistics in High School
StudyinNC State • Thanks for Dr.Hollylynne Leeaccept me as an international visiting student and work with her HiRise team. • At the beginning, Hollylynne showed me how they do the teachers profession development by internet, it is quite different from China. She also invited me take two MOOCs to learn as an in-service teacher and enhance my understanding about statistics instruction. I was also attending and participating as an invited guest in EMS 519, Teaching and Learning of Statistical Thinking. • I am also invited to attend the development of ESTEEM. • During these days, I learned a lot about statistics education and teacher profession development.
What is statistics and why should teach it? • Statistics is a art and science learning from data, it as all things of data. It is anything that has do with data, not just number but text. • Statistics is a methodological discipline. • Today, people are surrounded by data, and the data generate all the time. It seems late for students begin to learn statistics in university. So we need teach them during K-12. This is a good period to develop their ideas about statistics.
The differences between math and statistics • Data are number with a context, and context provides meaning. • Context is crucial and paramount, this is a primary difference between mathematics and statistics. • Statistical inquiry is dependent on data and grounded with context. Rossman, A., Chance, B., & Medina, E. (2006)
The differences between math and statistics • Variation is everywhere. • Variability affects all aspects of life and everything we observe. There are many resources related to it. Include measurement, nature, sampling and induced variability. • Statistics, utilizes inductive reasoning and conclusions are always uncertain. • There is not always an only correct answer of a statistics question. Lack of definitiveness mean that not all analyses are equally reasonable and statistics could be used to prove any desired conclusion. ASA(2005)
The differences between math and statistics • Measurement and data collection are also important in statistics. • Drawing conclusion from data depends on taking valid measurements of the properties being studies. • The design of the data collection strategy also determines the scope of conclusions that can be drawn.
The differences between math and statistics • Statistics education become increasingly mathematical as the level of understanding goes up • But data collection, exploration of data, interpretation of results should be paid more attention in statistics education. These are dependent on context, through K-12, involve limited formal mathematics. Ben-Zvi,2006
Statistics habit of mind • Always consider the context of data • Ensure the best measure of an attribute of interest • Anticipate, look for, and describe variation • Attend to sampling issues • Embrace uncertainty, but build confidence in interpretations • Use several visual and numerical representations to make sense of data • Be a skeptic throughout an investigation Ben-Zvi,2006
LOCUS Question from LOCUS
The framework-SASI Lee, Tran(2015)
Developing the inferential reasoning • It is important thing in statistics learning. • Using data and information available to make claim about something larger or beyond the data itself. • The key to develop it includes contextual data, analyzing data with multiple representations, considering variability, communicates a level of uncertainty. Lee, H. S. & Mojica, G. F. (2017)
Technology in statistics education • For developing students’ statistics profiency, it is better to use real data and context instead of pre-constructed. • The size of real data is always big to deal with without technology. • Using technology could make the process visible and make it easy to understand. • Technology facilitate the team work in statistics investigation process. • We used CODAP when we took the MOOCs.
Developing EDA with technology and communication • The MOOCs and EMS 519 offer many different tasks of statistics in secondary school. And I used CODAP to complete the tasks. My work with CODAP within vehicle task
Developing EDA with technology and communication Heather’s work
Developing EDA with technology and communication Use the data from C@S to complete a statistical investigation.
Experienceof Online Courses • . The Units of the Mooc
Experienceof Taking Online Courses The structure of every unit: Engage with Essentials: Some articles help you get a understanding of this unit Learn From Experts: videos about expert idea about this unit. Dive Into Data: Experience the statistical activities and process as students Discuss Learning and Practices: A forum for learners express their ideas with each others Extend Your Learning: More Resources for Learners to Deepen Understanding Unit Feedback Survey: Questionnaire about Learners’ Feedback
Work with Hi-Rise Dr Lee is teaching students Students are interesting in using CODAP. Dr Lee is introducing the CODAP
Math Teachers PD in China OpenClass Lectures from Experts Instruciton from Experienced Teacher Grouptalk
What elements make MOOCs excellent • Method and framework. • Examples of teaching practices. • Conversation with experts. • Interviewing the classroom teachers. • Discussion with other parteners.
How to use technology • In the class, teachers also could use it to show the statistical process. • It is dynamic and visualized, students could watch how the data is organized in the statistical process. • More important, it is easy for operating and very pure for students undertake statistical activities. The basic manipulation for user are click and drag. • The function of this tool is correspond to the standards. (Boxplot, mean, mode and other knowledges mentioned in the Common Core)
Impact statistics teaching in China • The first and most important thing is change teachers mind about statistics is just a branch of mathematics. • I think this could be combined with my Chinese advisor‘s PD program. It is also an online courses. • Make teachers undergo a new statistics investigation cycle, because teachers are also taught in traditional way so many years, there are some incorrect ideas about statistics in teachers’ mind. • Try to let teachers accept new software to do statistics. • Due to wake of statistics knowledge of Chinese math teachers,so enhance their knowledge is also important.
Main idea of my dissertation • The research aims at revealing the relation between practical knowledge and skill of high school mathematics teachers. Through assessing teachers’ knowledge, observing their class teaching to analysis what factors will influence instruction results. So the research questions are : • 1. Through what theoretical framework can help us analyze the practical knowledge and skill of statistics of high school mathematics teachers? • 2. Is there any relativity between the statistical teaching knowledge of and teaching skill? • 3. Is there any obvious correlation between mathematics teacher's statistical knowledge and statistical teaching results?
Main idea of my dissertation • First step is assessing the level of practical knowledge of high school math teachers. Questionnaire will be divided into 4 parts, CCK, SCK, KCS and KCT. • Question of CCK is about knowledge of statistical, choosing from textbook and other examination and LOCUS. • SCK part will assess teachers’ statistical thinking, reasoning and literacy. • KSC part will assess teachers’ understanding of their students’ statistical knowledge, thinking and so on. • KCT part will assess teachers’ understanding of standards Burgess(2008)
Main idea of my dissertation • After a questionnaire survey and data analysis, select different performance teachers for classroom observation. For the sake of consistency, the theoretical framework of classroom observation is also divided into four dimensions, just like the theoretical framework of the questionnaire. When conducting classroom observation, we mainly pay attention to the time, frequency, level and correctness of teachers in the process of statistical teaching, and then carry out coding analysis. The observation scale is to be adapted based on the Burgess statistical knowledge scale.
Reference • Decision on Reform of School System(1953) • The Decision on the Reform of the Education System(1985) • Outline of China's Education Reform and Development(1993) • Rossman, A., Chance, B., & Medina, E. (2006). Some important comparisons between statistics and mathematics, and why teachers should care. In G. F. Burrill & P. C. Elliott (Eds.), Thinking and reasoning with data and chance: Sixty-eighth NCTM yearbook (pp. 139-150). Reston, VA: National Council of Teachers of Mathematics. • Lee, H. S. & Mojica, G. F. (2017). The importance of context to support inferential reasoning. In Teaching Statistics Through Inferential Reasoning MOOC for Educators, Friday Institute for Educational Innovation: NC State University, Raleigh, NC • Lee, H. S., & Tran, D. (2015). Statistical habits of mind. In Teaching statistics through data investigations MOOC-Ed, Friday Institute for Educational Innovation: NC State University, Raleigh, NC. • Ben Zvi, D., & Garfield, J. (2004). Statistical literacy, reasoning, and thinking: goals, definitions and challenges. In D. Ben-Zvi & J. Garfield (Ed.). The challenge of developing statistical literacy, reasoning, and thinking (pp. 3-15). Kluwer • Wild, C. J., & Pfannkuch, M. (1999). Statistical thinking in empirical enquiry. International Statistical Review, 67(3), 223-248.
Reference • Tran, D., & Lee, H. S. (2015). The difference between statistics and mathematics. In Teaching statistics through data investigations MOOC-Ed, Friday Institute for Educational Innovation: NC State University, Raleigh, NC. • delMas, R. C. (2004). A comparison of mathematical and statistical reasoning. In B.-Z. Dani & J. Garfield (Eds.), The challenge of developing statistical literacy, reasoning and thinking (pp. 79-95). Netherlands: Kluwer Academic Publishers. • Rossman, A., Chance, B., & Medina, E. (2006). Some important comparisons between statistics and mathematics, and why teachers should care. In G. F. Burrill & P. C. Elliott (Eds.), Thinking and reasoning with data and chance: Sixty-eighth NCTM yearbook (pp. 139-150). Reston, VA: National Council of Teachers of Mathematics.
Welcome to ECNU Thank you for your coming and welcome to ECNU