Download
1 / 15
150 likes | 249 Vues
Occupational and Wage Inequality in the U.S. Labor Market. Sam Levitus Mentor: David L. Schaffer University of Wisconsin- Eau Claire. Method. We used Stata to analyze hourly wages calculated from the Current Population Survey.

E N D
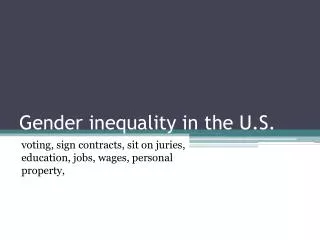
Occupational and Wage Inequality in the U.S. Labor Market Sam Levitus Mentor: David L. Schaffer University of Wisconsin-Eau Claire
Method • We used Stata to analyze hourly wages calculated from the Current Population Survey. • We excluded all calculated hourly wages that were either missing values or less than zero. • We analyzed the distribution of these wages by educational attainment, race, and the “class” of the job (private sector, government, self-employed, etc.)
Changes in Wage Inequality since 1970 • Generalized Entropy Index—a single numerical summary of income inequality. The higher the index, the more unequal the distribution. • We measured the GE Index for each year from 1970 through 2009, first for all real hourly wages, and then truncated to exclude wages less than $1/hour and greater than $1,000/hour. We used a parameter theta of 1. • Inequality has increased moderately for the truncated group, but skyrocketed for the non-truncated group.
The Percentiles • We used Stata to sort the hourly wages and separate them into percentiles. • Using constant 1995 dollars, we plotted the mean hourly wage for selected percentiles for each year from 1970 to 2001. • We also plotted the change from 1970 directly to 2001 (2001 wage minus 1970 wage) for each percentile. • Preliminary results show that the upper percentiles have made the greatest real gains, while the lower and middle ranges have stagnated.
Changes from 2005 to 2010 • We analyzed the changes in hourly wages—in constant 2010 dollars—by educational attainment and race, over the period from 2005 to 2010 for each 5-percentile range. • Preliminary results show that higher educational levels have made the most gains, and the lowest levels the least. • We also considered changes within different racial categories, but results are inconclusive.
Lorenz Curve by Class of Job, 2010 • We generated Lorenz curves for each “class” of job for 2010. The available classes were private sector; federal, state, and local government; self-employed both incorporated and non-incorporated, and “without pay”—a total of seven classes. • Preliminary results suggest that the private sector and self-employed (non-incorporated) showed the greatest variability in wages, and federal and state government the least.
Conclusion • In every aspect except (perhaps) race, wage inequality has increased markedly in the last forty years, and even noticeably in the last six years. So far, we have no significant evidence that the Great Recession has ameliorated this trend. • We are unsure of the exact cause of this increase in inequality. It may not all be completely reducible to economics—part of the increase may be due to moral and political values, which don’t show up in data sets! • We are also unsure of the implications for public policy—this is a truly disturbing trend with no simple solutions. Unfortunately, Americans are often reluctant to talk about economic inequality.