Download
1 / 27
270 likes | 309 Vues
This paper presents the EUSAAR strategy for sampling and analyzing carbonaceous aerosols, covering positive and negative artifact assessment, validation methods, intercomparisons, and towards establishing a reference method for thermal-optical analysis of OC and EC.

E N D
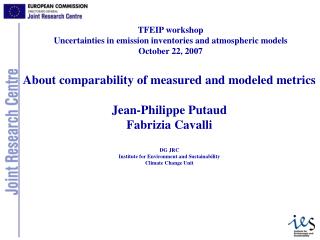
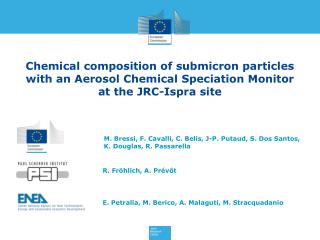
Progress on sampling and analysis of carbonaceous aerosols: The EUSAAR strategy Jean-Philippe Putaud, Fabrizia CAVALLI, EC-JRC-IES
1 Progress in the validation of the sampling train for particulate carbonaceousmatter: • ▪Positive artifact mitigation • ▪Negative artifact assessment • 2 Progress in defining a reference method for thermal-optical analysis of OC+ EC: • ▪ CEN WG on OC and EC in PM • 3 EUSAAR intercomparisons for OC / EC / TC measurements: • ▪Results of the 3rd and 4th intercomparisons • ▪Next intercomparison in 2010
1- POC / EC sampling train validation Positive artifacts • ▪ Positive OC artifacts contribute 14 – 70 % of particulate OC on • plain QFF (site and season dependent) • ▪ Denuder mean performance ranges from 43 to 93% (site and season dependent) • ▪ Positive OC artifacts are reduced to 5 – 21 %
1- POC / EC sampling train validation Negative artifacts: new tests Sampling head ▪ NO news from supplier on special production of suitable sorbents ▪ NO alternative in the very recent literature + blank problems ▪ Tried again quartz fiber filter as back-up filter in two different experiment types Denuder Carbon honeycomb monolith Front quartz filter Back-up filter
1- POC / EC sampling train validation Negative artifacts: new tests Sampling head 24-hr sampling 20 cm/s face velocity 14 < T < 28°C Denuder Carbon honeycomb monolith Front quartz filter Two back-up quartz filters
1- POC / EC sampling train validation Negative artifacts: new tests Quartz fiber filter as back-up absorbent: ▪ efficiency 80% ▪ negative artifact = only 3% compared to particulate OC ▪ very limited set of data
1- POC / EC sampling train validation Negative artifacts: new tests additionally C D A B Teflon filters Sampling head 24-hr sampling 20 cm/s face velocity Denuder Front quartz filter Day i Day i + 1
1- POC / EC sampling train validation Negative artifacts: new tests in Ispra DAY i A & B OC = OCparticulate i + OCresidual positive art i+ OCnegative art i DAY i+1 C OC = OCparticulate i + OCresidual positive art. i+ OCnegative art i + + OCresidual positive art i+1+ OCnegative art i+1 C-A ΔOC = OCresidual positive art i+1+ OCnegative art i+1 Additionally, DAY i+1 D OC = OCresidual positive art i+1
1- POC / EC sampling train validation Negative artifacts: preliminary results C-A ΔOC = OCresidual positive art i+1+ OCnegative art i+1 D OC = OCresidual positive art i+1 ▪ The OCresidual positive art is 0.37 0.17 gC/m3 (0.54 0.21 gC/cm2) in winter and 0.57 0.22 gC/m3 (0.77 0.32 gC/cm2) in summer. Range confirmed in 2010 tests, 0.42 0.22 gC/cm2. The negative artifact would represent up to 20% of the OCparticulate
2- Towards a reference method for OC / EC thermal–optical analysis The EUSAAR_2 protocol F. Cavalli, M. Viana, K. E. Yttri, J. Genberg, and J.-P. Putaud (2010). Toward a standardised thermal-optical protocol for measuring atmospheric organic and elemental carbon: the EUSAAR protocol. Atmos. Meas. Tech., 3, 79–89.
2- Towards a reference method for OC / EC thermal–optical analysis CEN working group on OC /EC 36 resolutions so far Resolution 3 • Analysis: EC and OC data should allow/support mass closure of PM along with other PM constituent determined e. g. within the AQD framework. Thereforea mass based technique should be used. • Links to other standards and network protocols The European Standard should not be developed in isolation from relevant work in other communities especially EMEP, EUSAAR and the US/Canada. Resolution 4 WG 35 agrees that the candidate standard method will be based on the analysis of samples collected on filters using the thermal method with optical correction for charring.
2- Towards a reference method for OC / EC thermal–optical analysis CEN working group on OC /EC Resolution 5 WG 35 agrees that a literature review and data analysis needs to be undertaken including: • OC and EC levels in blank filters, • Artifacts (i.e. filter types), • Round robin tests, • Role of carbonates. These results will feed into an uncertainty assessment. Resolution 6 WG 35 agrees that a field study is needed to set up a well validated standard. The field study shall allow the evaluation of different protocols of the thermal method with optical correction for charring. Both optical parameters transmission and reflectance shall be recorded to allow an evaluation of charring correction. This will include both off-line and on-line analysis.
2- Towards a reference method for OC / EC thermal–optical analysis • CEN working group on OC /EC • Resolution 21 • To extend and clarify Resolution 7, WG 35 agrees that the choice of analytical protocol for EC and OC (and possibly TC and IC) in the standard shall be based on: • - comparability with one of the three widely-used existing protocols EMEP (EUSAAR2), NIOSH, and IMPROVE, and reproducibility (ie relative insensitivity to small variations in the actual method used) • - lack of systematicbias or interference (eg consideration of the effect of IC, results of analysis of “pure” OC or EC) • practicality (ie time and cost implications).
2- Towards a reference method for OC / EC thermal–optical analysis • CEN working group on OC /EC • Resolution 35 • Given • -the urgent need for Member States to have a standardised method for EC/OC, • in the absence of a mandate from the Commission (DG ENV), • the WG agrees that they will work on a CEN Technical Report for EC/OC as a priority. This TR will describe several methods (e.g. thermal protocols) that will give different results for EC and OC, because validation data is needed both to specify one standard method and to properly characterise that method. • The standard method will be proposed within 3 years from the mandate from the DG ENV.
3- OC / EC / TC intercalibration - 2008 ▪ Ambient aerosol samples collected by 4 partners at their sites (BIR, MSY, KPO, ISP) ▪ Samples distributed to 12 EUSAAR-NA2 partners + 12 associates ▪ Use of the EUSAAR_2 thermal-optical protocol was advised
3- OC / EC / TC intercalibration - 2008 TC relative to avrage TC from EUSAAR partners • On average, TC carbon can be determined within ±30% error wrt average by • - 10 among 10 EUSAAR partners • - 7 among 9 EUSAAR associates
3- OC / EC / TC intercalibration - 2008 EC / TC relative to EUSAAR _2 • On average, EC / TC ratio can be determined within ±30% error wrt average by • ▪7 among 8 EUSAAR partners • ▪4 among 9 EUSAAR associates
3- OC / EC / TC intercalibration - 2009 ▪NIST reference material 8785 (urban dust on quartz fibre filter) ▪ Samples distributed to 12 EUSAAR NA2 partners
3- OC / EC / TC intercalibration – NIST reference material TC amounts (µg / cm²)
3- OC / EC / TC intercalibration TC relative to NIST reference values
3- OC / EC / TC intercalibration EC/TC relative to NIST reference values 2008
3- OC / EC / TC intercalibration- NIST reference material • TC : conclusions • ▪ most partners report TC values that clearly larger than the ref. value • ▪ 2009’ biases cannot explain the ±30% deviation observed in 2008 • ▪the overall uncertainties are large => this intercomp. is not stringent • EC /TC : conclusions • ▪ EC / TC ratios range from 0.26 to 0.55 • ▪ differences in line with previous intercomparison
3- OC / EC / TC intercalibration • Next intercomparison in 2010 • ▪ Ambient aerosol samples • ▪Soot loaded filters • In June 2010 punches will be distributed among partners. • EMEP stations reporting OC/EC data are invited to participate • please send an e-mail to: • fabrizia.cavalli@jrc.ec.europa.eu
1- POC / EC sampling train validation Positive artifacts
1- POC / EC sampling train validation Positive artifact mitigation
1- POC / EC sampling train validation Positive artifact determination
3- OC / EC / TC intercalibration- 2008 EC / TC ratio