mcmaster/#
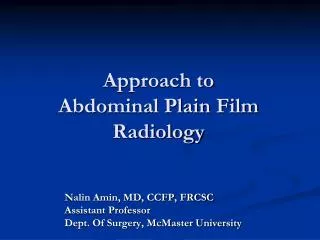
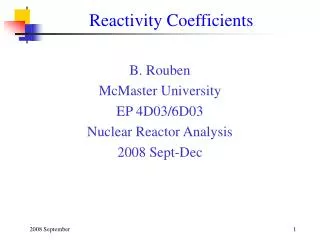
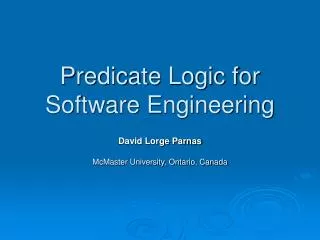
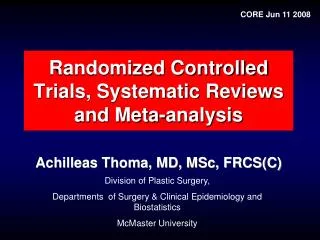
http://www.mcmaster.com/#. WHAT IS A WELDMENT?. http://www.voisard.com/albums/products/slides/Weldment.html. WHAT IS A WELDMENT?. http://winman.ca/portfolio/weldments.htm. WHAT IS A WELD?. WELDMENTS IN SOLIDWORKS. ROPS.SLDPRT. TRUSS.SLDPRT. WHAT IS SHEETMETAL?. support bracket.SLDPRT.

mcmaster/#
E N D
Presentation Transcript
WHAT IS A WELDMENT? http://www.voisard.com/albums/products/slides/Weldment.html
WHAT IS A WELDMENT? http://winman.ca/portfolio/weldments.htm
WELDMENTS IN SOLIDWORKS ROPS.SLDPRT TRUSS.SLDPRT
WHAT IS SHEETMETAL? support bracket.SLDPRT
WHERE ARE WE IN THE DESIGN PROCESS? FUNCTIONAL DECOMPOSITION DECISION MATRIX QFD CAD Engineering Simulation ENGINEERING SIMULATION AND ANIMATION
ENGINEERING SIMULATION OR ENGINEERING ANALYSIS OR ENGINEERINNG MODELING
EVOLUTION OF DESIGN PROCESS TRADITIONAL PRODUCT DESIGN PROCESS SIMULATION DRIVEN PRODUCT DESIGN PROCESS DESIGN CAD SIMULATION solid CAD FEA PROTOTYPING PROTOTYPING TESTING TESTING affordable computers Windows OS PRODUCTION PRODUCTION
ENGINEERING DESIGN MODELS STRUCTURE Descriptive and graphical e.g. diagrams of how elements are connected and arranged FUNCTION Generally abstract e.g. mathematical models FORM Descriptive and graphical e.g. drawings of parts and assemblies FORM, FUNCTION AND STRUCTURE CAE models
Power Supply C1 + MIC +9V R3 R4 R8 R5 R1 3 C 2 B Q1 + - 741 E 4 7 R2 6 C2 + R6 LED R7 LENS Components: 741 OP AMP R1 = 50 kW (Variable) R2 = 1 MW R3 = 5.6 kW R4 = 5.6 kW R5 = 1 kW R6 = 50 kW (Variable) R7 = 1 kW R8 = 220 W C1 = 0.1 mF C2 = 10 mF Q1 = 2N3904 LED MIC : Microphone Vcc = 9 V STRUCTURE MICROPHONE with two wires: 2.2 kW 1 Power Supply Output 2 MIC 1 mF Ground AM Light Wave Transmitter
STRUCTURE Pneumatic Logic Diagram
STRUCTURE Pneumatic Logic Diagram
FUNCTION System diagram of a sensor system
Differential amplifier INPUT Reference value OUTPUT Constant speed shaft Rotating Shaft Amplifier Motor Measurement Tachnogenerator Shaft Speed Control FUNCTION System diagram of a shaft speed control
FUNCTION Vibration of a single degree of freedom system Deflection of a cantilever beam
FUNCTION System diagram of a car steering
FUNCTION Ackerman steering geometry is defined by angling the steering arms so that a line drawn between both the king pin and steering arm pivot points intersects with the centre line of the rear axle. System diagram of a car steering
FUNCTION Model captures FUNCTION but not FORM Ackerman.SLDASM
FUNCTION Transfer Function - is the input-output relationship of a system (or subsystem). OUTPUT = TRANSFER FUNCTION X INPUT Example: For a gear box: output angular velocity = C X input angular velocity where C is some constant (i.e. transfer function). Model captures FUNCTION but not FORM transfer function.SLDASM
FUNCTION Model captures FUNCTION but not FORM Oldham coupling.SLDASM
FORM – Engineering Drawings Layout Drawing – drawn to scale but does not show tolerances, and is subject to change as the design process continues.
FORM – Engineering Drawings Detail Drawing – includes tolerances and indicates materials & lists special processing requirements. Drawn in conformance with ANSI drawing standards.
FORM – Engineering Drawings Detail Drawing – includes tolerances and indicates materials & lists special processing requirements. Drawn in conformance with ANSI drawing standards.
FORM – Engineering Drawings Assembly Drawing – uses an exploded view to show how some of the individual parts fit together. Components are identified by a part number or entry on an attached bill of materials.
FORM – Engineering Drawings Information on a Bill of Materials: 1. The item number or letter. This is a key to the components on the assembly drawing. 2. The part number. This number is used throughout the purchasing, manufacturing, inventory control, and assembly system to identify the component. 3. The quantity needed in the assembly. 4. The name or description of the component. This must be a brief, descriptive title for the component. 5. The material from which the component is made. If the item is a subassembly, then this does not appear in the BOM. 6. The source of the component. If the component is purchased, then the name of the company is listed. BILL OF MATERIALS (BOM) Typical assembly drawing with parts list.
FORM, FUNCTION AND STRUCTURE CAE models
COMPUTER AIDED ENGINEERING (CAE) TOOLS IN MME2259a • CAD • geometric modeling of parts and assemblies • drafting • visualization (eg. shading, photo-rendering) • SIMULATION TOOLS • Motion animation (SOLIDWorks) • Structural analysis (Simulation Express) Use of Motion Analysis is required in the Design Project The use of Simulation Express is not required in the Design Project. Familiarity with Simulation Express is required to pass CSWA (10% bonus) exam.
MOTION ANALYSIS Deciding Which Type of Study to Use Use Animation to create presentation-worthy animations for motion that does not require accounting for mass or gravity. Use Physical Simulation to create presentation-worthy approximate simulations of motion that account for mass, collisions, or gravity. Use Motion Analysis to run computationally strong simulations that take the physics of the assembly motion into account. This tool is the most computationally intensive of the three options. The better your understanding of the physics of the motion you require, the better your results. You can use Motion Analysis to run impact analysis studies to understand component response to different types of forces.
DIFFERENCE BETWEEN A MECHANISM AND A STRUCTURE Structure is firmly supported, mechanism is not. Mechanism moves without having to deform its components. Mechanism components move as rigid bodies. Generally, a mechanism is designed to move. Mechanism has Rigid Body Motions (RBM). Structure does not have Rigid Body Motions, any movement of a structure must involve deformation. It may be one time deformation when the static load is applied or vibration about its neutral position (point of equilibrium). Generally a structure is designed to stand still.
DIFFERENCE BETWEEN A MECHANISM AND A STRUCTURE STRUCTURES MECHANISMS
COMMON KINEMATIC PAIRS (MECHANISM COMPONENTS) Revolute 1 DOF left cylindrical 2 DOF left Spherical 3 DOF left Translational (prismatic) 1 DOF left Planar 3 DOF left
RIGID BODY MOTION How many rigid body motions?
MOTION ANALYSIS: ANIMATION OF MOTION quick return.SLDASM
STRUCTURAL ANALYSIS: ANIMATION OF MODES OF VIBRATION tunning fork.SLDPRT
MOTION ANALYSIS: ANIMATION OF MOTION http://www.eng.uwo.ca/designcentre/FEA%20resources/
STRUCTURAL ANALYSIS – Simulation Xpress In class demonstration
ANTHROPOMETRIC DATA Vast amount of information is available on-line
WHAT IS A PERCENTILE? Percentile One of a set of points on a scale arrived at by dividing a group into parts in order of magnitude. For example, a score equal to or greater than 97 percent of those attained on an examination is said to be in the 97th percentile. Estimates proportions of the data that should fall above and below a given value.
SIZE VARIATIONS IN A POPULATION Taller than 97.5% of population Taller than 50% of population Taller than 2.5% of population In general body heights and body lengths do vary uniformly in a population because they depend upon bone structure.
WEIGHT VARIATIONS IN A POPULATION In general weights and widths may not vary uniformly since these measurements depend upon age, amount of body fat, musculature, etc.
ANTHROPOMETRIC DATA Civilian populations: 97.5 percentile 50 percentile (median) 2.5 percentile
ANTHROPOMETRIC DATA Range-of-Motion R.J. Eggert, Engineering Design, Prentice-Hall:Upper Saddle River NJ, 2005, pp. 262.
ANTHROPOMETRIC DATA Range-of-Motion R.J. Eggert, Engineering Design, Prentice-Hall:Upper Saddle River NJ, 2005, pp. 263.