Download

1 / 74
740 likes | 766 Vues
Detailed overview of Department of Transport's performance in 2010/11, covering achievements, investments, and legislative initiatives.

E N D
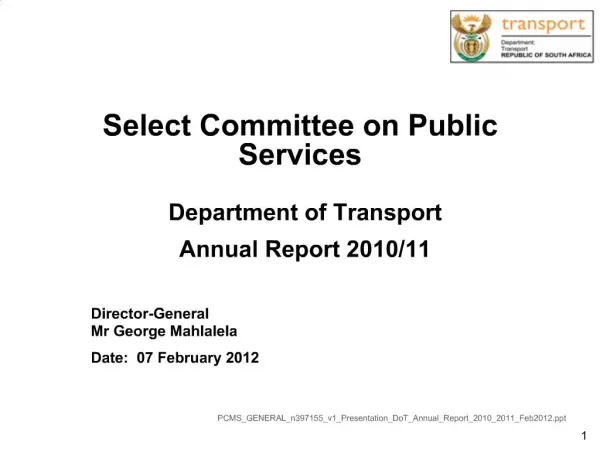
Select Committee on Public Services Department of Transport Annual Report 2010/11 Director-General Mr George Mahlalela Date: 07 February 2012 PCMS_GENERAL_n397155_v1_Presentation_DoT_Annual_Report_2010_2011_Feb2012.ppt 1
Contents Section 1: Programme Performance Report for 2010/11 Section 2: Audit Outcomes for 2010/11 Section 3: Highlights of 2010/11 Financial Statements Section 4: Human Resource Management & Development PCMS_GENERAL_n397155_v1_Presentation_DoT_Annual_Report_2010_2011_Feb2012.ppt 2
Section 1: Programme PerformanceReport for 2010/11 • Highlights of the performance of the Department • Selected performance indicators • Detailed Performance in 2010/11: • Per outcome • Per programme PCMS_GENERAL_n397155_v1_Presentation_DoT_Annual_Report_2010_2011_Feb2012.ppt 3
Highlights of the Performance of the Department in 2010/11 • The development of integrated public transport systems, including the bus rapid transit networks and taxi empowerment continued • Investments continued in rail infrastructure, stations and rolling stock and the Gautrain rapid rail link • The long distance bus company, Autopax, was recapitalised. • Investment in the national road network and the focus on asset preservation and maintenance has continued • Completed the national master plan, and the 2020 public transport action plan • Two Chapters of the South African Maritime Chamber were established in Kwa-Zulu Natal and the Eastern Cape with the intention of organising one voice of BEE companies and to meet the requirements in bilateral negotiations • The process of ratifying the African Union Maritime Charter has progressed successfully PCMS_GENERAL_n397155_v1_Presentation_DoT_Annual_Report_2010_2011_Feb2012.ppt 4
Highlights of the Performance of the Department in 2010/11 (Continued) • A draft version of the Maritime Transport Policy was tabled and is currently being reviewed • Phase one operational plans to support the public transport strategy were developed in five cities. Three other cities developed draft operational plans • Technical reviews of transport were undertaken in Cape Town, Johannesburg, Tshwane, Nelson Mandela Bay and Buffalo City • The Gautrain project was 99,1% complete by the end of February 2011, compared to 99,8% planned • The draft Road Accident Benefit Scheme policy has been revised and finalised following consideration of public comments, and the legislative drafters for the no-fault policy / Road Accident Benefit Scheme have been appointed • Public Transport Integration Committees were established in all provinces. • Draft 9 of the performance based quality contract model for the Public Transport operations grant was developed and consulted 5
Highlights of the Performance of the Department in 2010/11 (Continued) • Rea Vaya Phase 1A Starter Service: • Commenced on 31 August 2009 • Operates on 25 kilometers of trunk route • Passenger numbers increased from a daily average of 11,800 in September 2009 to highs of 20,000 per day in January 2010 • A total of 28 articulated buses with a carrying capacity of 117 passengers and 6 complementary buses with a carrying capacity of 81 passengers are used to operate 203 trips per day • The City of Johannesburg handed over Rea Vaya operations to the Taxi Operators Investment Company, formally taking control of the Bus Rapid Transport's bus operating company to operate Rea Vaya’s Phase 1A PCMS_GENERAL_n397155_v1_Presentation_DoT_Annual_Report_2010_2011_Feb2012.ppt 6
Highlights of the Performance of the Department in 2010/11 (Continued) • Legislation implemented: • Implemented legislation to have buses tested for roadworthiness every 6 months • Transport Acts Repeal Bill • Legislation approved by Parliament • Safe Container Bill • Merchant shipping (Safe Containers) Bill • Legislation processed for debate in Parliament: • South African Maritime Aeronautical Search and Rescue Amendment Bill 2010 • Maritime Transport Security Bill 2010 PCMS_GENERAL_n397155_v1_Presentation_DoT_Annual_Report_2010_2011_Feb2012.ppt 7
Highlights of the Performance of the Department in 2010/11 (Continued) • Legislation to be approved by the Minister and Cabinet: • The Civil Liability Convention Bill • Oil Pollution Compensation Bill • Electronic Fare Collection Regulations • Merchant Shipping Civil Liability Convention Bill 2010 • Merchant Shipping International Oil Pollution Compensation Fund Contribution Bill 2010 PCMS_GENERAL_n397155_v1_Presentation_DoT_Annual_Report_2010_2011_Feb2012.ppt 8
Highlights of the Performance of the Department in 2010/11 (Continued) • The following studies were finalised: • The feasibility of the development of a Transport Data Act • The contribution of civil aviation to the South African economy • The post implementation practicalities of inter-modal transport • The socio-economic impact of open skies / Yamassoukro Declaration • The socio-economic benefits of roads on the South African economy • The development of car ownership and use in South Africa PCMS_GENERAL_n397155_v1_Presentation_DoT_Annual_Report_2010_2011_Feb2012.ppt 9
Detailed Performance in 2010/11 - Per outcome PCMS_GENERAL_n397155_v1_Presentation_DoT_Annual_Report_2010_2011_Feb2012.ppt 11
Outcome 1:An effective and integrated infrastructure network that serves as a catalyst for social and economic development 12
Outcome 1:An effective and integrated infrastructure network that serves as a catalyst for social and economic development (Continued) PCMS_GENERAL_n397155_v1_Presentation_DoT_Annual_Report_2010_2011_Feb2012.ppt 13
Outcome 2: A transport sector that is safe and secure 14
Outcome 2: A transport sector that is safe and secure (Continued) PCMS_GENERAL_n397155_v1_Presentation_DoT_Annual_Report_2010_2011_Feb2012.ppt 15
Outcome 3: Improved rural access, infrastructure and mobility PCMS_GENERAL_n397155_v1_Presentation_DoT_Annual_Report_2010_2011_Feb2012.ppt 16
Outcome 4: Improved public transport system 17
Outcome 4: Improved public transport system (Continued) 18
Outcome 5: Increased contribution to job creation 19
Outcome 6: Increased contribution of transport to environmental protection PCMS_GENERAL_n397155_v1_Presentation_DoT_Annual_Report_2010_2011_Feb2012.ppt 20
Detailed Performance in 2010/11 - Per programme PCMS_GENERAL_n397155_v1_Presentation_DoT_Annual_Report_2010_2011_Feb2012.ppt 21
Detailed Performance in 2010/11 Transport Policy, Research and Economic Analysis PCMS_GENERAL_n397155_v1_Presentation_DoT_Annual_Report_2010_2011_Feb2012.ppt 22
Detailed Performance in 2010/11 Transport Regulation and Accident and Incident Investigation PCMS_GENERAL_n397155_v1_Presentation_DoT_Annual_Report_2010_2011_Feb2012.ppt 23
Detailed Performance in 2010/11 Integrated Planning and Inter-sphere Co-ordination PCMS_GENERAL_n397155_v1_Presentation_DoT_Annual_Report_2010_2011_Feb2012.ppt 24
Detailed Performance in 2010/11 Freight Logistics and Corridor Development PCMS_GENERAL_n397155_v1_Presentation_DoT_Annual_Report_2010_2011_Feb2012.ppt 25
Detailed Performance in 2010/11 Public Transport PCMS_GENERAL_n397155_v1_Presentation_DoT_Annual_Report_2010_2011_Feb2012.ppt 26
Detailed Performance in 2010/11 Public Entity Oversight and Border Operations and Control 27
Section 2: Audit outcomes for 2010/11 • REPORT ON LEGAL AND REGULATORY REQUIREMENTS • Predetermined objectives • Reliability of information • Compliance with laws and regulations: • Irregular expenditure • Fruitless and wasteful expenditure • INTERNAL CONTROL • Leadership • COMMITMENTS TO ADDRESS INTERNAL CONTROL DEFICIENCIES 28
Commitments to address internal control deficiencies • Auditor’s Dashboard Report on the drivers of internal control • Commitments to address deficiencies in internal control: • Leadership • Financial and performance management • Governance • Compliance Template 33
Dashboard report (continued) PCMS_GENERAL_n397155_v1_Presentation_DoT_Annual_Report_2010_2011_Feb2012.ppt 35
Commitments: Leadership • Commitments: • Table performance reports (EXCO, • Audit Committee) • Part of performance agreements • Penalty regime • Compliance template • Report actions taken to EXCO • and Audit Committee • Governance audit • Each Programme responsible • Report to EXCO on Board • meetings • Minister to meet Chairpersons • Develop integrated IT policy • and address shortcomings per • IT audit Dashboard: Performance reporting Performance monitoring Implement action plans to address weaknesses Oversight over public entities IT governance framework 37
Commitments: Financial and performance management • Commitments: • Sign off on reports • Process for filing project reports • Filing on E-DOT • Reports substantiated by evidence • Report poor performance to EXCO • Establish a Compliance Unit • Develop compliance template • Report to EXCO on compliance • Review eNaTIS system and • database logs • Update Disaster Recovery Plan • Implement actions to address • finding of the IT audit Dashboard: Performance reporting Evidence of performance Monitor compliance Controls over IT systems 38
Commitments: Governance • Commitments: • Review framework, policy, strategy • and risk management structures • Involve senior managers • Flatter specialised structure • Standing item on EXCO and OPC • Flatter specialised structure • Training and skills transfer Dashboard: Risk management Strengthen Internal audit 39
Compliance template • The Executive Committee approved a detailed compliance template against which the status of high level compliance matters and reporting can be checked. The compliance template covers the following: • Standing governance structures and procedures • General reporting and other requirements • Annual Report – high level requirements • Budgeting • Ad hoc reporting • Reporting in terms of the Division of Revenue Act • Reporting in terms of the Division of Revenue Act Frameworks • Reporting by public entities 40
Section 3: Highlights of 2010/11 Financial Statements • Adjusted budget 2010/11 • Reprioritisation in 2010/11 • Under (over) expenditure in 2010/11 • Breakdown of expenditure in 2010/11 41
Reprioritisation in 2010/11 (Continued) 44
Programme Expenses Budget Variance % Variance 1 245,383,834 253,034,000 7,650,166 3.02% 2 38,868,846 42,251,000 3,382,154 8.00% 3 398,076,240 398,077,000 760 0.00% 4 6,966,573,436 6,978,571,000 11,997,564 0.17% 5 20,980,818 25,867,000 4,886,182 18.89% 6 17,259,340,893 17,441,869,000 182,528,107 1.05% 7 145,821,165 149,414,000 3,592,835 2.40% Grand Total 25,075,045,234 25,289,083,000 214,037,766 0.85% Under / (over) expenditure per Programme 2010/11 Major under expenditure: P1: Savings on office accommodation RK7,649 P2: Delayed work on establishment of the Rail Economic Regulator R1,7m and Compensation of Employees P4: Savings after R37,65m was shifted from capital P5: Delay in Sustainable Rural Development and Transport Plan R3,5M and savings P6: Under spent on scrapping of taxis R158,7m, under spent and savings P7: Under spent R1,8m and savings R1,7m 45
Percentage STANDARD ITEM Expenses Budget Variance Variance Current: 930,547,693 983,894,000 53,346,307 5.42% Compensation of Employees 250,757,397 252,764,000 2,006,603 0.79% Goods and Services 678,292,042 731,130,000 52,837,958 7.23% Financial transactions 1,498,254 0 (1,498,254) N/a Capital: - Machinery and Equipment 1,888,119 3,914,000 2,025,881 51.76% Transfers: 24,142,609,422 24,301,275,000 158,665,578 0.65% Departmental Agencies & Accounts 6,985,744,000 6,985,930,000 186,000 0.00% Foreign memberships 4,732,608 5,420,000 687,392 12.68% Households 339,957,397 497,740,000 157,782,603 31.70% Non Profit Institutions 15,981,000 16,017,000 36,000 0.22% Provincial & Local Governments 8,022,293,000 8,022,293,000 0 0.00% Public Corporations & Private Enterprises 8,765,206,000 8,765,206,000 0 0.00% Universities & Technicons 8,695,417 8,669,000 (26,417) (0.30)% Grand Total 25,075,045,234 25,289,083,000 214,037,766 0.85% Under / (over) expenditure per economic classification 2010/11 46
Under / (over) expenditure per Programme and classification 49
Expenditure breakdown for 201011 35,0% Total 99,78% 27,3% 15,4% 14,8% 2,7% 1,8% 1,4% 1,0% 0,6% 50