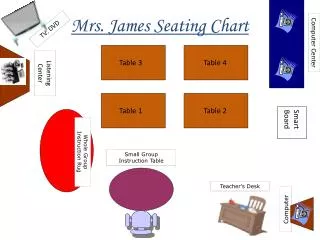
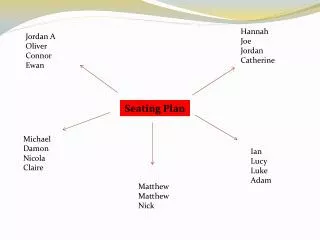
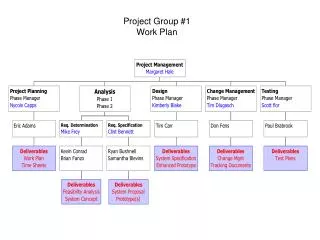
Seating Plan (Group Work)
Seating Plan (Group Work). Chloe Potts Kayte Davis. Kylie Jack. AJ James. Chloe Marson Pav. Lewis Josh. Seating Plan (Group Work). Andrew Rheace Dan Jamie Aaron. Ryan Omar Connor. M Connor S. Ramandeep Iqra Zoe Beth Lydia. Demi Brad Josh Chelsie Holly. Nicola


Seating Plan (Group Work)
E N D
Presentation Transcript
Seating Plan (Group Work) Chloe Potts Kayte Davis Kylie Jack AJ James Chloe Marson Pav Lewis Josh
Seating Plan (Group Work) Andrew Rheace Dan Jamie Aaron Ryan Omar Connor. M Connor S Ramandeep Iqra Zoe Beth Lydia Demi Brad Josh Chelsie Holly Nicola CallumS Alex Paul Keanan
Attitude to Learning: • Group leader • They are in charge of behaviour & learning for their table. • Teacher to focus on learning
Group Settler Activity - UK Population Pyramid Recap All Learners Should: 1) Sketch a diagram for the UK population pyramid. 2) Label the different stages of the pyramid e.g. low birth rate (number of babies born is going down). Most Learners Should move onto: 3) What does the UK Population pyramid show? 4) What are the benefits of this? 5) What are the drawbacks of this? Some Learners Should also: 6) The UK Population Pyramid fits Stage 4 of the Demographic Transition Model – give reasons for this. Use the Population Pyramid Information Board.
Settler Activity: Student choice Menu: Imagine you have a conversation with the UK population pyramid, choose one of the activities below: Last lessons Learning Outcome: Will be able to identify the main features of a Population Pyramid in order to understand the population structure of a country.
Is there a relationship between the population structure and the level of economic development of a country? Learning Outcome: All Learners: Will be able to interpret population pyramids through drawing sketch diagrams to represent the four stages of the Demographic Transition Model. Then begin to identify how the birth and death rate of a country changes as a country becomes more wealthy. Most Learners: Will be able to describe how sketch pyramids can be drawn to represent the four stages of the Demographic Transition Model. Then explain the relationship between the population structure and the level of economic development of a country. Some Learners: will be able to analyse the relationship between the population structure and the level of economic development of a country. Competence: Motivation.
Keywords: Population Pyramid Demographic Transition Model Birth Rate Rostow Model
Producing a Sketch Diagram of a Population Pyramid High Death Rate High Birth Rate Most Learners: Will be able to describe how sketch pyramids can be drawn to represent the four stages of the Demographic Transition Model.
Task 1) Research Instructions: 1) Using Google, search: ciasierra leonefactbook • Then clickPeople & Society Tab 2) Write up: a) The 5 useful things for this website are..? Extension: How could this website help you meet the learning outcome? Most Learners: Will be able to describe how sketch pyramids can be drawn to represent the four stages of the Demographic Transition Model.
Task 2) Population Pyramids - Sketch Diagrams In groups, using the CIA Factbook website, research the following countries: Activity: Produce sketch a diagram for each population pyramid. Label each graph e.g. birth / death rate / life expectancy. EXTENSION: Label your graph with data from the website in order to improve the quality of your response.
Mini Plenary: Difference between a developed and an un-developed country is….? Un-Developed Country Sierra Leone Developed Country United Kingdom Reason for high death rate: Famine, war, poor medical knowledge, lack of jobs & few opportunities. Stage of the Demographic Transition Model: 1 Reason for Low death rate: Job opportunities, excellent healthcare, NHS, clean water & access to food, . Stage of the Demographic Transition Model: 4
As the UK became increasingly wealthy – i.e. developed - the population structure of the UK changed. The UK 2013 The UK 1750
Therefore, the population structure for the UK was very different to that of today! • High birth rate • High death rate • Limited access to doctors • No running water • Dirty toilets
Reasons why countries become more developed? SimCitygame is tasked with populating and developing tracts of lands into cities, while fulfilling the needs of its people. Task 1) Watch the following clip: http://jsbgeography.blogspot.co.uk/2011/09/rostow-model-and-sim-city-comparison.html Task 2) In groups, write down 5 ways in which an undeveloped country could become developed.
Rostow’s Model of Development Task: In groups, produce a SimCity diagram for each stage of the Rostow model.
Keywords: Population Pyramid Demographic Transition Model Birth Rate Rostow Model
Mini Plenary: Graffiti wall of your learning today Most Learners: Will be able to explain the relationship between the population structure and the level of economic development of a country.
Seating Plan (Individual) Jamie Iqra
Research Task: • Produce a detailed, well explained report describing and explaining how the population structure of a country changes shape as it becomes moreeconomically developed (i.e. more wealthy). You will need to consider : • All Learners: • Draw a sketch diagram of a Population Pyramid for Stages 1 and 4 of the demographic transition model (e.g. Sierra Leone and the UK). • Briefly describe the birth and death rate for each population pyramid that you sketch. • Draw a labelled diagram for the Rostow model. • Begin to identify how the population changes from a county being an LEDC to an MEDC. • Most Learners: • Describe how sketch pyramids (e.g. sketches of a population pyramid) can be drawn to represent the four stages of the Demographic Transition Model. You may wish to sketch the outline of each stage. • Hypothesise (i.e. predict) and draw a population pyramid for the fifth stage of the Demographic Transition Model. • Explain how the population changes from a county being an LEDC to an MEDC. You will need to draw a copy of the Rostow model for economic model and explain what it means. • Some Learners: • Will complete all the above to outstanding level, using key vocabulary and detailed analysis. • Use detailed research to demonstrate your understanding.
Revision Points Write down 3 important things that you have learnt from today’s lesson. 1. 2. 3. Keywords: Dependency Ratio, Population Pyramid, Demographic Transition Model, Birth Rate, Rostow Model.
Dependency Ratio This can be worked out from a population pyramid (number of children under 15 plus number of adults over 65 multiplied by 100 divided by number of adults between 16 and 64). Discuss the assumptions the dependency ratio appears to be based on.