y10
1145.6752. 1203.2416. 100. 1203.7777. 1352.8610. b4. 1402.8927. 1267.3093. 428.2862. y11. 1404.3127. b2. 1145.0150. Leu/Ile. 185.1569. 497.2947. 995.6017. 86.1075. y9. 1504.8939. y10. %. y14. 1140.6858. 995.1141. 244.1283. 598.3857. y1. y15. 994.6033. 902.5410.

y10
E N D
Presentation Transcript
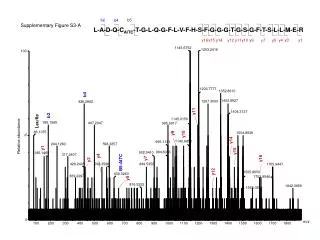
1145.6752 1203.2416 100 1203.7777 1352.8610 b4 1402.8927 1267.3093 428.2862 y11 1404.3127 b2 1145.0150 Leu/Ile 185.1569 497.2947 995.6017 86.1075 y9 1504.8939 y10 % y14 1140.6858 995.1141 244.1283 598.3857 y1 y15 994.6033 902.5410 185.1469 317.2407 y4 y7 y16 y3 B5-AITC 428.2405 598.3588 849.5350 1705.9447 y12 1505.8650 630.3260 369.2297 1703.9546 y5 816.5252 1842.0669 1568.0350 0 m/z 100 200 300 400 500 600 700 800 900 1000 1100 1200 1300 1400 1500 1600 1700 1800 b2 b5 b4 Supplementary Figure S3-A L-A-D-Q-CAITC-T-G-L-Q-G-F-L-V-F-H-S-F-G-G-G-T-G-S-G-F-T-S-L-L-M-E-R y3 y15 y16 y14 y12 y11 y10 y9 y7 y5 y4 y1 Relative abundance
a2 y5 173.1548 549.3812 100 Gln 101.0837 b3 329.2354 b2 % y8 201.1514 1052.5950 y7 y9 937.5107 y6-AITC y10 1151.6619 y2 y1 276.1707 1298.7457 Leu/Ile b4 751.4085 375.2576 476.3233 Val Phe y11-NH3 694.3785 652.4036 y11 427.2511 1409.8063 631.3890 838.5336 1427.8250 1035.5554 0 m/z 100 200 300 400 500 600 700 800 900 1000 1100 1200 1300 1400 1500 Supplementary Figure S3-B b3 b4 b2 S-I-Q-F-V-D-W-CAITC-P-T-G-F-K y11 y9 y1 y10 y8 y7 y6 y5 y2 Relative abundance
240.1713 100 y12 1291.8058 1290.8140 371.2478 1290.7745 % y6 y1 y4 703.4360 y9 175.1410 y10 y7 503.3447 y11 143.1359 989.6654 816.5463 988.6354 1089.7015 b2 1203.8160 y13 Leu/Ile Y12-NH3 314.2002 y8 1404.9197 y3 887.6008 86.1110 y5 y14 385.2536 632.4158 1203.6884 Met 432.2861 Val 1535.9708 y15-AITC 1187.7821 988.5891 1403.8164 1534.9471 571.3677 1638.9448 0 m/z 100 200 300 400 500 600 700 800 900 1000 1100 1200 1300 1400 1500 1600 1700 Supplementary Figure S3-C b2 A-V-CAITC-M-L-S-N-T-T-A-I-A-E-A-W-A-R y1 y13 y7 y3 y15 y14 y12 y11 y10 y9 y8 y6 y5 y4 Relative abundance
Supplementary Figure S3-D 245.1210 b4 b6 b8 100 y2 218.1393 E-I-V-H-I-Q-A-G-Q-CAITC-G-N-Q-I-G-A-K 381.2041 y7 y6 y5 y3 y2 y4 y1 y1 217.1296 147.1061 625.3122 136.0754 Relative abundance 408.1829 % Leu/Ile y5-NH3 86.0988 Gln 512.2213 y3 a4 275.1631 626.2971 b4 His b6 y7 461.2409 687.3334 366.1324 y4 409.1648 b8 591.3275 702.3482 513.2377 295.1182 790.3524 y6 852.4048 889.3348 1068.4974 725.3630 546.3411 0 m/z 1150 100 150 200 250 300 350 400 450 500 550 600 650 700 750 800 850 900 950 1000 1050 1100
197.1579 100 y8 y13 836.5527 1226.7664 298.2250 Leu/Ile 1169.2244 86.1110 y7 749.5031 y13 y11 1227.7847 1168.7212 1325.8462 y10 y9 y5 1068.6786 % 837.5429 593.3911 967.6196 1326.8513 b2 187.1703 1069.6411 Thr 215.1716 750.5110 y1 1228.7777 1070.6766 1327.8434 968.6159 y4 y14 299.2236 Pro y3-AITC y6 492.3258 838.5656 1438.8866 969.6010 1229.7712 692.4985 898.5433 506.3130 1439.8917 751.5093 y15 449.7587 594.3776 1328.8494 y16 1440.9530 1576.0443 391.2648 1441.0089 1690.0559 0 m/z 100 200 300 400 500 600 700 800 900 1000 1100 1200 1300 1400 1500 1600 1700 1800 b2 Supplementary Figure S3-E L-T-T-P-T-Y-G-D-L-N-H-L-V-S-A-T-M-S-G-V-T-T-CAITC-L-R y6 y16 y15 y14 y13 y11 y10 y8 y7 y5 y4 y3 y1 y12 y9 Relative abundance
y2 272.1621 100 170.0834 % 218.0958 b2 104.0572 246.0898 273.1586 y6 y7 b3 731.2916 862.3066 377.1200 y4-AITC y5 863.3118 153.0603 377.1415 360.1091 660.2182 344.0844 589.1997 864.3176 632.2508 1003.2960 0 m/z 100 150 200 250 300 350 400 450 500 550 600 650 700 750 800 850 900 950 1000 1050 1100 Supplementary Figure S3-F b2 b3 N-M-M-A-A-CAITC-D-P-R y7 y6 y5 y4 y2 Relative abundance Met
Supplementary Figure S3-G y4 482.2914 b2 100 T-A-V-CAITC-D-I-P-P-R b2 173.0909 y7 y5 y4 y3 y2 y6 y1 a2 145.0959 y3 369.2157 Val Relative abundance y6-AITC % 72.0912 y1 799.3260 175.1155 y5 597.3197 483.2858 Leu/Ile 799.2844 352.1721 700.3019 y2 86.1056 370.2063 800.3667 272.1500 599.3089 Gln y7 484.2975 215.1227 101.0693 351.2059 666.3687 898.3891 701.3539 456.1971 309.1891 600.3272 801.3873 580.2929 765.3835 898.3339 537.2963 403.2097 900.3975 898.3009 743.2614 0 m/z 50 100 150 200 250 300 350 400 450 500 550 600 650 700 750 800 850 900 950 1000