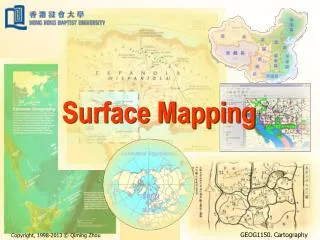
Mapping the Surface
This guide outlines the essentials of surface field maps, which represent measurable quantities like temperature and pressure across a region. Key concepts include isolines, which connect points of equal values, such as isotherms for temperature and isobars for pressure. We also explore gradients, which indicate the rate of change in field values, and the importance of consistent distance intervals between isolines. Additionally, the guide explains topographic maps that depict physical features like mountains and valleys using contour lines, providing a comprehensive overview for students and enthusiasts.


Mapping the Surface
E N D
Presentation Transcript
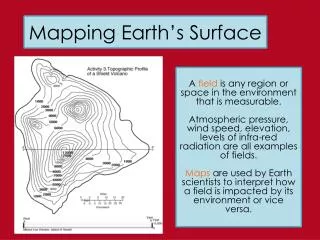
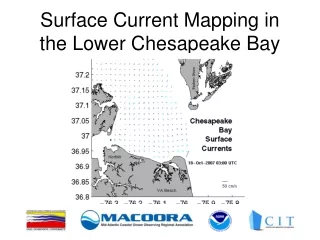
Field Maps • A Field is a region that has a measurable quantity such as temperature, pressure, elevation, etc. that is recorded at every point
Each plotted point is the temperature at that location in the field.
Isolines • Connect points of equal field values • Isotherms connect points of equal temperatures • Isobars connect equal pressures • Contour Lines connect points of equal elevations
Gradient • Gradient, or slope, is the rate at which a field value changes • ESRT has the equation on the cover ROC = Change in field value Distance
Interval • The difference in value between one isoline to the next • The interval must remain the same for every location on a map. (Doesn’t change)
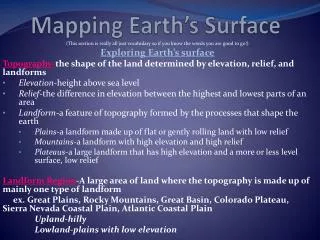
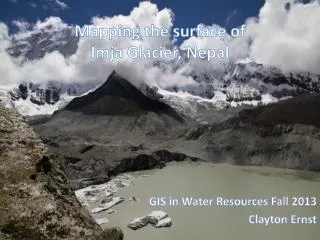
Topographic Maps • Used to show topography (physical features) of land • Ex. Mountains, valleys, cliffs and depressions • Uses contour lines