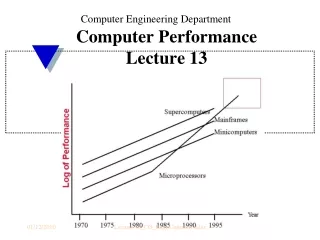
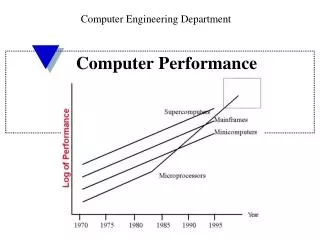
Computer Performance
Computer Engineering Department. Computer Performance. Case Study. A company wants to re-design its computer M BASE (5 GHz) to beat the competition, using a hardware team and a compiler team. Instruction CPI i Frequency class

Computer Performance
E N D
Presentation Transcript
Computer Engineering Department Computer Performance
Case Study A company wants to re-design its computer MBASE (5 GHz) to beat the competition, using a hardware team and a compiler team. Instruction CPIi Frequency class A 2 40% B 3 25% C 3 25% D 5 10% By optimizing the hardware and changing the clock to 6 GHz Instruction CPIi Frequency class A 2 40% B 2 25% C 3 25% D 4 10%
Case Study - continued The CPI for each machine is CPI MBASE = 2x0.4 + 3x0.25+3x0.25+5x0.1 = 2.8 cycles/instr. CPI MOPT = 2x0.4 + 2.0.25+3x0.25+4x0.1 = 2.45 cycles/instr. The MIPS for each machine are MIPS = # Instructions = # Instructions Execution time # CPU cycles/frequency MIPS = Clock frequency (Million cycles/sec) CPI MIPS MBASE = 5 x 103 = 1,785 MIPS 2.8 MIPS MOPT = 6x 103 = 2,429 MIPS MIPS MOPT = 2449 = 1.37 2.45 MIPS MBASE 1785
Case Study - continued The Compiler team will leave the architecture unchanged (5 GHz clock), but wants to reduce the number of instructions when the high level code is converted to assembly language. Instruction Class % Instruction to Execute vs. Base A 90% B 90% C 85% D 95% So the ratio of instructions overall is =.9x.4+.9x.25+.85x.25+.95x.1 = 0.81 The new CPI = 2x.4x.9 + 3x.25x.9 + 3x.25x.85 + 5x.1x.95 = 3.1 0.81
Case Study - continued The resultant speed up from Compiler optimization is CPU time MBASE=Inst. Count x CPI = Inst. Count x 2.8 Clock frequency Clock frequency CPU time MOPT=Inst. Count x 0.81x3.1 = Instr. Count x 2.5 Clock frequency Clock frequency So the speed up is CPU time MBASE= 2.8 = 1.12 (or 12% improvement) CPU time MOPT 2.5 If BOTH hardware and software are optimized, CPI MBOTH = (2x0.4x0.9+2x0.25x0.9+3.0.25x0.85+4x0.1x0.95)/0.81 So CPI MBOTH = 2.7 cycles/instruction
Case Study - continued The resultant speed up from optimizing BOTH hardware and software CPU time MBASE = Clock frequency BOTH CPIBASE = 6 x109 x 2.8 CPU time MBOTH0.81Clock frequency BASE CPI BOTH 4.05x10⁹ 2.7 1.54 or 54% improvement The improvements take time… and the competition advances too Optimization Method Time taken Improvement Hardware 6 months 37% Compiler 6 months 12% Both 8 months 54% We know that CPU performance grows 50%/year or 3.8% /month
Case Study - conclusions So the competition will have a CPU performance increase in six months of (1.038)6 = 1.25 In eight months the CPU performance will grow (1.038)8 = 1.35 So only optimizing the compiler will not be sufficient either MOPTor M BOTHis the way to go!
Another way to judge performance- Benchmarks • These are libraries of programs that designers and consumers run on various computers to compare their performance. • They emulate a workload similar to the application that the consumer intends to use the computer for, or the designer wants to optimize for. • One advantage of benchmarks is reproducibility such that two or more designs can be compared before a computer hits the market; • To assure objectivity benchmarks are established by an independent committee.
Benchmarks - continued • This organization is the Standard Performance Evaluation Corporation (SPEC) http://www.specbench.org/ • They publish benchmark results for CPUs, as well as graphics cards, web servers and other architectures. • Since this is a fast-changing field, so do the benchmark ( for CPUs we had SPEC CPU95, which was replaced by SPEC CPU2000, CPU2004 and now SPEC CPU2006) • For servers they used SPECweb99 now replaced by SPECweb2005
Benchmarks - continued • Regardless of version and targeted hardware, benchmarks are a collection of programs, not just one. Since each benchmark program (within a given benchmark library) is different, results need to be summarized. • How is execution time used with benchmarks? • Example Machine A Machine B Benchmark program 1 10 100 Benchmark program 2 1000 100 Benchmark program 3 500 550 Total execution time (sec) 1510 650
Benchmarks - continued • Performance A/Performance B = Exec. Time B/Exec. Time A = 650/1510 = 0.43 or Performance B = 2.32 Performance A • Thus Machine B is more than 2 times better than A, even though in two of the Benchmark programs Machine A was faster. • Thus total execution time is an indicator of performance if each of the benchmark programs is executed once (or an equal number of times). • Another measure is arithmetic mean = Sum Timei Where Timei is the time taken to execute n program i and n is the total number of programs in the benchmark
Benchmarks - continued • If not all programs in the benchmark are executed the same number of times, then we need to use a weighted Arithmetic mean = Sum (Wi Timesi)/n where Wi is the weight assigned to the program i of the benchmark. • A normalized execution time is the ratio of the time taken to execute a given program on a given computer versus the same program being executed by a “reference” computer. • A better way to gauge performance is to use the Geometric mean of normalized execution time. sqrtn ( a1 x a2x ……x an ), where ai = execution time ratio for program i out of n programs.
Benchmarks - continued • The number of programs has grown in SPEC 2000 to 12 integer programs and 14 floating point programs • Additional reading
Benchmark Comparison (on SPEC CPU2000) The comparison of Pentium III and Pentium IVs • Both scale linearly with clock rate (aggressive caching reduces memory penalty) • Pentium 4 uses different pipeline and instructions which boost fp computations
Benchmarks and Energy efficiency • Reducing power means reducing voltage and/or reducing clock frequency – a technique used in laptops and other mobile applications; • Processors then have three modes: max clock, adaptive clock, minimum clock (minimum power).
Benchmarks and Energy efficiency • Energy efficiency= performance/avg. power consumption (watts); • Pentium M (part of Centrino)– designed from the start for mobile computing has superior energy efficiency vs. the Pentium III-M and Pentium 4-M which are modified versions of the standard processors 1 GHz to 2.26 GHz depending on voltage
Dual-core Architecture Places two processors on a single chip (ex. Intel Core Duo). http://www.digital-daily.com/cpu/new_core_conroe/
Benchmarks - continued • A normalized execution time is the ratio of the time taken to execute a given program on a given computer versus the same program being executed by a “reference” computer. • A better way to gauge performance is to use the Geometric mean of normalized execution time. sqrtn ( a1 x a2x ……x an ), where ai = execution time ratio for program i out of n programs.
Benchmarks - continued Spec CPU2006 has 13 integer tasks (Standard Performance Evaluation Co.) and 18 floating point tasks. The elapsed time in seconds for each of the benchmarks in the CINT2006 or CFP2006 suite is given and the ratio to the reference machine (a Sun UltraSparc II system at 296MHz), is calculated. The SPECint_base2006 and SPECfp_base2006 metrics are calculated as a Geometric Mean of the individual ratios, where each ratio is based on the median execution time from three runs. SPEC CPU2006 Benchmark Descriptions http://www.spec.org/cpu2006/publications/CPU2006benchmarks.pdf
Spec CPU2006 for Multi-core CPUs Compared to a reference machine 296 MHz UltraSPARC II processor - reference
Multi-core Benchmarks http://www23.tomshardware.com/cpu_2007.html?modelx=33&model1=921&model2=868&chart=424
Actual Target Workload Full Application Benchmarks Small “Kernel” Benchmarks Microbenchmarks Pros Cons Evaluation Summary • very specific • non-portable • difficult to run, or • measure • representative • portable • widely used • improvements useful in reality • less representative • easy to run, early in design cycle • easy to “fool” • “peak” may be a long way from application performance • identify peak capability and potential bottlenecks
Additional readings • The Efficeon product sheet at www.transmeta.com/pdfs/brochures/efficeon_tm8600_processor.pdf • Multi-Core Processor Architecture Explained http://www3.intel.com/cd/ids/developer/asmo-na/eng/211198.htm?page=2&=prn • Performance Scaling in the Multi-Core Era http://www.intel.com/cd/ids/developer/asmo-na/eng/dc/threading/290740.htm