Download
1 / 40
410 likes | 657 Vues
Data Variables & Unit of Observation. Statistics. (The field of) Statistics is the systematic study of data. The word “data” is plural… “The data are the price gains of 200 stocks on the NYSE.” Singular? “Datum.” (Uncommon.) Shares of Exxon-Mobil gained 2.3%. The datum is 2.3%.

E N D
Statistics (The field of) Statistics is the systematic study of data. The word “data” is plural… “The data are the price gains of 200 stocks on the NYSE.” Singular? “Datum.” (Uncommon.) Shares of Exxon-Mobil gained 2.3%. The datum is 2.3%. What characterizes data is variability.
Variables / Units of Observation Units of observation: Set of entities (things / objects) being studied Variable: An attribute of units Suppose X describes a variable and U describes the units. “X varies among the (statistical) units.”
Units of Obs Math 158-800 students. Variable: Gender. Gender is a Categorical Variable Gender varies among Math 158-800 students.
Units of Obs Math 158-800 students. Variable: Number of FB friends. Number of FB friends is a Quantitative Variable Number of FB friends varies among Math 158-800 students.
1. An experiment was conducted to test the performance of four brands of batteries in three different environments (room temperature; hot and humid; cold). For each combination of brand and environment, batteries were put into a flashlight. The flashlight was then turned on and allowed to run until the light went out. The amount of time until the flashlight stopped shining (in minutes) was recorded. Do brand and environment play a role in the lifetime of these batteries? Minutes are measurement units. Most quantitative variables have a measurement unit. If I want the measurement unit, I’ll say exactly that. By “unit” I mean “unit of observation” = thing / object that is studied.
2. 55 year old men are recruited into a study about heart attacks. The heart rate of each man is recorded. Each is tracked for a one-year period, and whether or not he has a heart attack is determined.
3. A student runs an experiment to study the effect of tire pressure on gas mileage. He devises a system so that his car uses gasoline from a one-liter container. Each time the container is filled, he randomly selects a tire pressure between 20 and 35 psi, then drives the car at 60 mph on a divided highway. When he runs out of gas, he records the distance driven on that fill. Does tire pressure impact the distance driven? Something like “drives” (the noun, not the verb) would also suffice for the units.
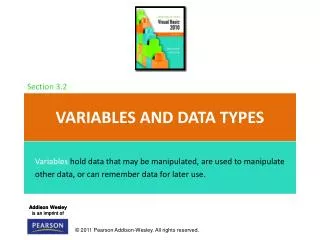
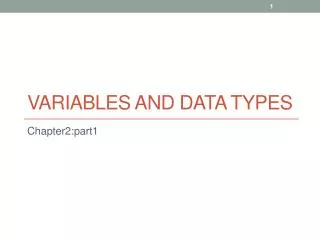
Types of variables Quantitative Variable Naturally measured as numbers for which ordering and at least some of the usual operations (addition, multiplication, subtraction, etc.) make sense. Discrete All the possible values are easily listed Frequent “ties” Often count or related to counts Continuous Technically: “ties” are impossible In practice ties are uncommon
Types of variables Categorical (Qualitative) Variable Not quantitative (usually verbal, but sometimes expressed as numbers having little or no number meaning). Categorical variables are discrete. So, the term discrete is rarely used in speaking about categorical variables – it is redundant.
Distribution A variable’s distribution is a description of what values it takes and how often it takes them. Categorical Variables Distributions are always summarized in terms of percents (falling into each category). Graphs include the pie chart, bar chart, and Pareto chart.
Distribution A variable’s distribution is a description of what values it takes and how often it takes them. Quantitative Variables There are many ways to summarize quantitative variables. Graphs: Relative frequency charts and histograms (very similar); boxplots; dotplots; stemplots; etc. Quantitative summaries: Mode; Range; Mean + Standard Deviation; Median + Interquartile Range
In a data table each unit takes a row; each variable occupies a column. Column headers identify variable names. There are other ways to organize data, and some are preferable when the idea is to display the data efficiently. However, in most cases, a data table is how data are organized in a spreadsheet.
Here are the monthly fees (in $) paid by a random sample of 50 users of internet service providers in 2008: 42 31 33 34 65 47 37 38 32 40 32 36 31 42 32 32 72 42 45 37 41 46 39 38 34 31 41 51 42 37 32 42 31 43 40 32 37 34 44 41 36 34 45 45 42 35 39 83 30 39 VARIABLE: ____________ UNITS: ____________
Here are the monthly fees (in $) paid by a random sample of 50 users of internet service providers in 2008: 42 31 33 34 65 47 37 38 32 40 32 36 31 42 32 32 72 42 45 37 41 46 39 38 34 31 41 51 42 37 32 42 31 43 40 32 37 34 44 41 36 34 45 45 42 35 39 83 30 39 VARIABLE: Monthly fee (for use of internet) UNITS: Users of internet service
You can start almost any problem in this course by first asking: What are the units? What is the variable? *Perhaps identified by name? (Names aren’t given here.) Often, unit identifiers will not be given or displayed.
Variables / Statistical Units The units of observation are the companies listed on the New York Stock Exchange. Describe a variable. Write the sentence variable _________ varies from company to company. Is the variable quantitative or categorical? If quantitative, is it discrete or continuous?
Distribution The distribution of a variable tells us what values it takes and the likelihood of those values. What the fees are. How often those fees occur.
VARIABLES (there are 5) UNITS X (Variable) varies from unit to unit.
VARIABLES (there are 5) UNITS City MPG varies from car model to car model.
VARIABLES (there are 5) UNITS Number of cylinders varies from car model to car model.
VARIABLES (there are 5) UNITS Transmission type varies from car model to car model.
VARIABLES (there are 5) UNITS Transmission type CATEGORICAL VARIABLE
VARIABLES (there are 5) UNITS City MPG QUANTITATIVE VARIABLE
VARIABLES (there are 4) UNITS
The Science of Statistics Data vary A population is a collection of all the units of interest. If we have information on all the units of a population we have a complete description of the variation in the data. Such a description of a population is a census. Characteristics of populations are parameters. A sample is an incomplete collection of units from the population. A sample necessarily provides incomplete information. Characteristics of samples are called (the word) statistics.
Variables / Statistical Units The units of observation are the countries (of the world). Describe a variable. Write the sentence _________ varies among __________. Is the variable quantitative or categorical?
Variables / Statistical Units The units of observation are the countries (of the world). Describe a variable. Write the sentence _________ varies among countries. Is the variable quantitative or categorical?
GDP per capita and Longevity NOT a unit
The Science of Statistics Data vary A population is a collection of all the units of interest. If we have information on all the units of a population we have a complete description of the variation in the data. Such a description of a population is a census. Characteristics of populations are parameters. A sample is an incomplete collection of units from the population. A sample necessarily provides incomplete information. Characteristics of samples are called (the word) statistics.
GDP per capita and Longevity Parameters Not statistics NOT a unit
Purposes of variables Explanatory and Response Variable Changing the value of the explanatory variable (EV) results in a change in the distribution of the response variable (RV). Loosely: A change in the explanatory variable alters the prediction of the response variable.
Variable: Form of study. Units: The (200) college students involved in the experiment. Form of study varies from student to student.
Variable: Score on the short answer test. Units: The (200) college students involved in the experiment. Score on the short answer test varies from student to student.
Experimental study The explanatory variable is assigned (often by the people conducting the study). Units do not enter the study with a value for this variable. Observational study The explanatory variable is a characteristic of the unit.