Chapter 6: Unemployment
Chapter 6: Unemployment. Historical Data (US). Historical Data (EU). Variations in Unemployment. Demographic Groups, 1997. Age. White-M. Black-M. Black-F. White-F. 14.3. 12.8. 36.5. 28.7. 16-19. 3.6. 3.7. 8.5. 8.8. 20+. Civilian Labor Force.

Chapter 6: Unemployment
E N D
Presentation Transcript
Variations in Unemployment Demographic Groups, 1997 Age White-M Black-M Black-F White-F 14.3 12.8 36.5 28.7 16-19 3.6 3.7 8.5 8.8 20+
Civilian Labor Force • Individuals between 16 and 64, who are employed for pay or unemployed • Individuals in prisons or mental hospitals, children, and retired are excluded
Unemployment • Members of the labor force who are: • 16 years of age or older • out of work • actively looking for work • Unemployment rate = No. of unemployed workers as a % of the labor force
Discouraged Workers • Members of the labor force who quit looking for jobs (e.g., the homeless) • Unemployment rate is underestimated by 2 to 3% because discouraged workers are excluded
Frictional Unemployment • Unemployment of individuals who are searching for jobs or waiting between jobs • Supply-side effect and transitional
Structural Unemployment • Unemployment due to fundamental economic changes that eliminate some jobs, while creating other jobs for which qualified workers may not be readily available • Normal due to technological advancement and changes in consumer preferences
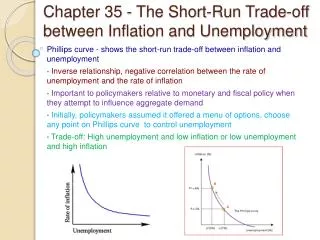
Cyclical Unemployment • Unemployment caused by contraction in economic activities (i.e., recession) • Needs public policy to increase employment
Natural Rate of Unemployment • An average rate around which the actual unemployment rate fluctuates • The average of last and next 10 years unemployment rate • Future unemployment rate is set at 5.5%
Duration of Unemployment • Short-term if frictional • Long-term if structural or cyclical • Evidence from 1974 is mixed • 60% of the spells of unemployment ended within one month • 69% of the weeks of unemployment occurred in spells that lasted two or more months
Duration of Unemployment • If policy goal is to reduce the natural rate of unemployment, we need long-term investment in job creation (education, training, etc.) • If policy goal is to reduce the unemployment rate, we need short-term investment in job retention and information
Unemployment Rate L = Labor Force E = Employment U = unemployment L = E + U So, E = L – U and U = L – E U/L = Unemployment Rate
Job Loss • s = the rate of job separation: the fraction of “employed” workers who lose jobs each month • sE = the number of “employed” workers who lose jobs each month
Job Gain • f = the rate of job finding: the fraction of “unemployed” workers who find jobs each month • fU = the number of “unemployed” workers who find jobs each month
Employment-Unemployment Transition The rates of job separation and job finding determine the rate of unemployment. Job Separation (s) Unemployed Employed Job Finding (f)
Steady State Unemployment Rate In a steady-state labor market: fU = sE Write: fU = s(L – U) fU = sL – sU sU + fU = sL (s + f)U = sL U/L = s / s+f
Example • s = 0.01: on average, jobs last 100 months • f = 0.20: on average, unemployment lasts 5 months • U/L = 0.01/0.21 = 4.8%
Policy Implications • Public policy to reduce the rate of job separation and/or increase the rate of job finding will lower the natural rate of unemployment • Public policy to lower the natural rate of unemployment must either reduce the rate of job separation or increase the rate of job finding
Policy and Frictional Unemployment • Job Fairs: • provide information on job openings, which lowers f and increases U/L
Policy and Frictional Unemployment • Unemployment Benefits: U/L could increase • Some unemployed workers may refuse job offers and wait for higher ones, lowering f • Some employed workers may not care losing jobs since their incomes are partially compensated, increasing s
Wage Rigidity and Unemployment Real Wage Supply Unemployment W2 A B W1 Demand Labor L2 L1 Amount of labor hired Amount of labor willing to work
Wait Unemployment • Unions setting wages higher than the market wage • Some union members must remain unemployed • Unemployed union members must “wait” for job openings
Minimum Wage law • Workers are paid a wage rate above the market rate • Help those who are employed • Hurt those who are unemployed
Efficiency Wage • Firms pay wages above the market values to • Maintain a stable labor force • Attract qualified workers • Improve productivity and profitability