Download
1 / 1
10 likes | 147 Vues
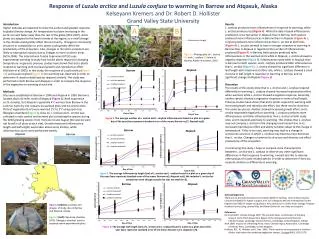
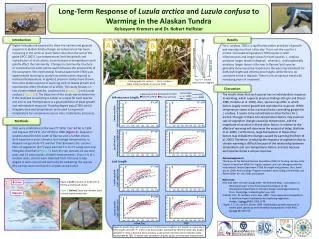
Long-Term Response of Luzula arctica and Luzula confusa to Warming in the Alaskan Tundra Kelseyann Kremers and Dr. Robert Hollister. Results. Introduction.

E N D
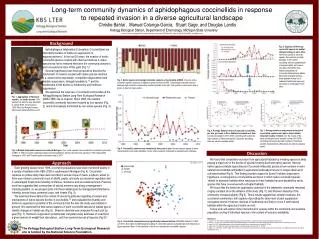
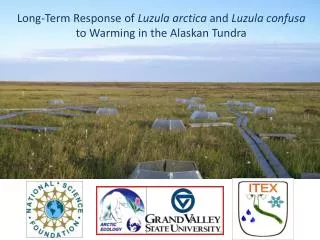
Long-Term Response of Luzula arctica and Luzula confusa to Warming in the Alaskan Tundra Kelseyann Kremers and Dr. Robert Hollister Results Introduction Higher latitudes are expected to show the earliest and greatest response to global climate change. Air temperature has been increasing in the arctic at much faster rates than the rest of the globe (IPCC 2007). Low temperatures limit the growth and reproduction of arctic plants, so an increase in temperature could greatly affect the community. Changes in community structure or composition of arctic plants could influence the productivity of the ecosystem. The International Tundra Experiment (ITEX) uses experimental warming to study how tundra plants respond to increased temperature. In general, previous studies have shown that arctic plants respond to warming with increased growth and reproductive effort (Hollister et al 2005). This study focuses on two closely related species, Luzula arctica (Figure 1A)and Luzula confusa (Figure 1B). The objective of this study was to determine if the response to warming is similar or unique for each species, and also to see if temperature is a good predictor of plant growth and reproductive response. Thawing degree days (TDD), which integrate time and temperature, were used to represent temperature for comparisons across sites, treatments, and years. Sites were established at Barrow (71°18’N, 156° 44’W) in 1994 and Atqasuk (70°29’N, 157°25’W) in 1996 (Figure 2). Atqasuk is located about 60 miles south of Barrow and is further inland. Both experience arctic climates, but average temperatures in Atqasuk are generally 4°C warmer than Barrow in the summer. Plots of vegetation (1m2) were warmed 1°C to 3°C using open-top fiberglass chambers (Figure 3). Each dry site contains 24 warmed plots and 24 control plots. Growth measurements (Figure 4) of L. confusa and L. arctica were collected from mid June to late August in each control and warmed plot containing the species (the species were not found in all plots at each site). For L. confusa, TDD is a significantly better predictor of growth and reproduction than Julian day. This is not the case for L. arctica. Increased temperature (TDD) results in taller inflorescences and longer leaves for both species. L. confusa produces longer leaves in Atqasuk, whereas L. arctica generally produces longer leaves in Barrow. In Barrow, both species generally show a positive response to the warming treatment for both leaf length and inflorescence height, while there is no consistent trend in Atqasuk. There is not an obvious trend with increasing years of treatment. The results show that each species has an individualistic response to warming, which supports previous findings (Chapin and Shaver 1985, Hollister et al. 2005). Also, species may differ in which factors largely control growth and reproductive response. While temperature seems to be a primary factor controlling growth for L. confusa, it seems to be subordinate to other factors for L. arctica. Changes in these non-temperature factors may slow the rate of vegetation change caused by temperature, and the magnitude of variation in these other factors in relation to the affects of warming will determine the amount of delay. (Hollister et al. 2005). Furthermore, large fluctuations in these other factors may exclude the changes caused by warming (Hollister et al. 2005). Therefore, predicting the response of vegetation due to climate warming is difficult because of the relationship between temperature and non-temperature factors, and also because each species shows a unique response. Acknowledgements: Thank you to the National Science Foundation (NSF) for funding, Barrow Arctic Science Consortium (BASC) for logistic support, and our colleagues with the International Tundra Experiment (ITEX) for insight and guidance. Also, thank you to GVSU Arctic Ecology Program members Jenny Leibig, Jeremy May, and Robert Slider for your help and support. References: IPCC (ed) 2007. Climate Change 2007: The Scientific Basis. Contribution of Working Group II to the Third Assessment Report of the Intergovernmental Panel on Climate Change. Cambridge University Press. Cambridge, United Kingdom. pp. 230 Hollister, R.D., P.J. Webber, and C. Bay. 2005. Plant response to temperature in northern Alaska: Implications for predicting vegetation change. Ecology 86(6): 1562-1570. Chapin, F. S., III, and G.R. Shaver. 1985. Individualistic growth response of tundra plant species to environmental manipulations in the field. Ecology 66: 564-576. A B Inflorescence Height Leaf Length Figure 4: Growth measurement diagram Figure 1:: Photographs of L. arctica (A)and L. confusa (B) taken at Barrow, Alaska in summer 2010 Discussion Inflorescence Length Leaf Length Atqasuk control 1998 1999 2000 2007 2008 Barrow control Barrow warmed Atqasuk warmed T R2=.347 T R2=.854 Luzula confusaInflorescence Height (cm) Methods J R2=.447 J R2=.590 Luzula arcticaInflorescence Height (cm) T R2=.543 T R2=.916 Luzula confusaLeaf Length (cm) Figure 2 (Left): Location of study sites at Barrow and Atqasuk, Alaska Figure 3 (Below): Open-top chamber used to warm experimental plots Barrow J R2=.695 J R2=.301 Atqasuk Luzula arcticaLeaf Length (cm) TDD Julian Day Figure 5: Graphs of growth measurement (inflorescence height or leaf length) vs. Julian day or TDD. Graphs denoted “T” show a trait that is better predicted by TDD than Julian day. Graphs denoted “J” show a trait that does not show a substantial improvement in prediction when represented by TDD. R2 values were calculated using the square of the growth measurement.