
Uploaded by
ataret
1 SLIDES
181 VUES
10LIKES
2010
DESCRIPTION
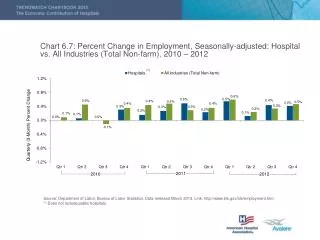
Chart 6.7: Percent Change in Employment, Seasonally-adjusted: Hospital vs. All Industries (Total Non-farm), 2010 – 2012. (1). 2011. 2010. 2012. Source: Department of Labor, Bureau of Labor Statistics. Data released March 2013. Link : http:// www.bls.gov/bls/employment.htm.
Download
1 / 1
Download Presentation

Télécharger la présentation
2010
An Image/Link below is provided (as is) to download presentation
Download Policy: Content on the Website is provided to you AS IS for your information and personal use and may not be sold / licensed / shared on other websites without getting consent from its author.
Content is provided to you AS IS for your information and personal use only.
Download presentation by click this link.
While downloading, if for some reason you are not able to download a presentation, the publisher may have deleted the file from their server.
During download, if you can't get a presentation, the file might be deleted by the publisher.
E N D
Presentation Transcript
Chart 6.7: Percent Change in Employment, Seasonally-adjusted: Hospital vs. All Industries (Total Non-farm), 2010 – 2012 (1) 2011 2010 2012 Source: Department of Labor, Bureau of Labor Statistics. Data released March 2013. Link: http://www.bls.gov/bls/employment.htm. (1) Does not include public hospitals


More Related
Audio
Live Player