Download
1 / 30
300 likes | 529 Vues
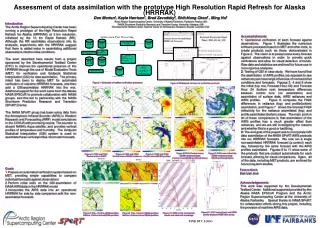
Preliminary Results of a U.S. Deep South Warm Season Deep Convective Initiation Modeling Experiment using NASA SPoRT Initialization Datasets for Operational National Weather Service Local Model Runs. Jeffrey M. Medlin 1 , Lance Wood 2 , Brad Zavodsky 3 Jon Case 4 and Andrew Molthan 3

E N D
Preliminary Results of a U.S. Deep South Warm Season Deep Convective Initiation Modeling Experiment using NASA SPoRT Initialization Datasets for Operational National Weather Service Local Model Runs Jeffrey M. Medlin1, Lance Wood2, Brad Zavodsky3 Jon Case4 and Andrew Molthan3 1NOAA National Weather Service; Mobile, AL 2NOAA National Weather Service (NWS); Houston, TX 3NASA SPoRT Center/Marshall Space Flight Center; Huntsville, Alabama 4 NASA Short-term Prediction Research and Transition (SPoRT) Center/ENSCO, Inc.; Huntsville, Alabama 2012 NASA SPoRT Virtual Partner’s Workshop 13 Sep 2012
Funct The Convective Initiation Forecast Problem (1) Function of Seasonal Progression (3) Surface Processes? Stronger Land-SST Gradient Spring Weaker Land-SST Gradient Summer (2) Function of Boundary Layer Convergence and Wind Flow over Local Terrain Medlin and Croft, 1998 Medlin and Croft, 1998 Medlin and Croft, 1998
Objectives • Objectively quantify impacts of NASA datasets (LIS, MODIS SSTs, GVF) on the summertime deep convective initiation mesoscale modeling problem. Will perform objective verification – more later. • Are surface processes (e.g., LH and SH fluxes, soil moisture, soil temperature) and ambient ingredients better represented in the initialization that, in turn, will improve timing and location of the first initiates? • Highlight how a NWS Operational Meteorologist-Researcher collaboration such as this can be invaluable towards addressing forecast problems. • Hopefully this collaborative approach can set a precedent for how local and/or regional mesoscale modeling may be approached in the future!
Methodology Using identical model settings on two separate WRFEMS-ARW Core domains, the NWS Mobile and Houston offices are concurrently evaluating the impacts of the following NASA SPoRT data sets on the summertime weak vertical wind shear deep convective initiation problem: • SPoRT SSTs – 2 km sea-surface temperature analysis, updated twice daily. • LIS - 3 km land information system, updated four times daily. • GVF – 1 km green vegetation fraction, updated daily. *** In other similar studies, each data set has been shown to improved convective initiation forecasts.
Model Settings • Domains = 9 km \ 3 km • Levels = 40 • Time Step = 54 s • Run Time = 6 UTC daily out to 24 h • Initial Conditions = GFS Personal Tile (0.205°) • Boundary Conditions = GFS Personal Tile (0.205°) • Convective Parameterization = Kain-Fritsch outer • Microphysics = WRF Single-Moment 6 Class • Boundary Layer Scheme = Mellor-Yamada-Janjic • Long-/Shortwave Radiation Schemes = RRTM, Dudhia
Experience with Limitations Regardless of any potential improvements discovered, the following will remain a challenge in regard to modeling the initiation of summertime deep convection with 3-4 km horizontal resolution: • Individual updrafts most often initiate too late and become too large. • Cannot just look at radar reflectivity! – must analyze ingredients, processes and character of local forcing.
Objective Verification - SPoRT MET Scripts Effectively evaluating model performance requires a combination of quantitative metrics and case studies. SPoRT has tailored existing MET (Model Evaluation Tools) scripts to meet WFO needs for performing objective-based model verification. Via examination of ‘bulk’ statistical differences [i.e., “SPoRT-Control”], and those that appear when stratified according to various pre-existing boundary layer conditions, it is our hope to improve our physical understanding of the convective initiation forecast problem.
Case 1 - Convective Initiation Case for Mobile-Pensacola and Mobile-Montgomery Inland Corridor, 3 July 2012 “The types of things we’re examining . . .”
- Area 1 – 17-18 UTC 3 July 2012 – 1858 UTC – 0.5 deg Base Ref NE PBL Wind flow - Area 2 – 18-20 UTC
? Very first initiates 18Z_CTL 1 km Radar Ref vs. 0.5 deg Lev II 18Z_OP 1 km Radar Ref vs. 0.5 deg Lev II
Surface Vegetation– 17 UTC (F11 h) [SPoRT-CTL] More greenedd Mini-Drought 12 June – 2 July Southern Plains Ridge “More Greenness” vs. Climo available for evapotranspiration SE of dashed line. Reflects latest drought trend well! Excellent GVF Paper! Case, J. L., F. J. LaFontaine, S. V. Kumar, and G. J. Jedlovec, 2011: A Real-Time MODIS Vegetation Composite for Land Surface Models and Short-Term Forecasting. Preprints, 15th Symp. on Integrated Observing and Assimilation Systems for the Atmosphere, Oceans and Land Surface, Seattle, WA, Amer. Meteor. Soc., 11.2 Less Greeness More Greeness 3 Jul 2012
Volumetric Soil Moisture – 06 UTC (F00 h) [SPoRT-CTL] “Mean volume of water per soil volume over a 5 cm depth” Initialization Drier than CTL inland – more moist N of sea-breeze along coast Drier More Moist 3 Jul 2012
Stronger Boundary Layer MFC vs. CTL 18Z_CTL 950hPa MFC vs. 0.5 deg Lev II 18Z_OP 950 hPa MFC vs. 0.5 deg Lev II
LH Flux– 17 UTC (F11 h) [SPoRT-CTL] SH Flux– 17 UTC (F11 h) [SPoRT-CTL] Greater latent heat flux ahead of sea-breeze and where first initiates observed inland BUT near zero to slightly lesser inland overall. Greater sensible heat flux ahead of sea-breeze AND where first initiates observed inland • Results from: • evaporation (↑flux; moist surface) • transpiraton (↑flux; leaves) • evaporation + transpiration = evapotranspiration • condensation (↓flux; dew deposition) • Determines how much heat is transferred above the surface -- important factor when predicting above-surface temperature and boundary layer depth from mixing. W/m2 W/m2 3 Jul 2012 3 Jul 2012
Skin Temperature (C)– 17 UTC (F11 h) [SPoRT-CTL] SH Flux– 17 UTC (F11 h) [SPoRT-CTL] Similar Similar Difference most noticeable over inland areas 10-13C Since skin temp greatly affects SH Flux (wT’), difference fields appear very similar Deg(C) W/m2 3 Jul 2012
950 hPaMixr– 17 UTC (F11 h) [SPoRT-CTL] LH Flux– 17 UTC (F11 h) [SPoRT-CTL] Lower q in general inland Higher q in general Greater latent heat flux ahead of sea-breeze BUT near zero to lesser inland where first initiates observed g/kg W/m2 3 Jul 2012 3 Jul 2012
SBCAPE – 17 UTC (F11 h) [SPoRT-CTL] SBCINH – 17 UTC (F11 h) [SPoRT-CTL] Lower SBCAPE Higher SBCAPE *Less negative energy that mechanically-forced parcel has to overcome all areas J/kg J/kg 3 Jul 2012 3 Jul 2012
Testing by Jonathan Case revealed this was a significant issue for our study, since platforms are different between SPoRT and the WFOs. • SPoRT has performed re-runs of our operational WRF for good candidate warm season CI days. • Examples of these variations from both WFO Mobile and WFO Houston follow. Non-Linear Variations due to Different Computational Platforms
Case study days were selected where no significant synoptic scale forcing was present. • We wanted to focus on CI along the sea/bay breeze boundaries and with differential heating. We want to see how the model is doing with 1st generation convection. • I would subjectively have a small preference for the SPoRT reflectivity forecast when compared to the Control for the small subset of cases that I have examined. • This particular case depicts a recurring warm season WRF issue across SW areas of the HGX CWA, where in general convection is over forecast by the model. This bias appears slightly greater in the Control run when compared to the SPoRT run. Case 2 - HGX - June 28th 2012 Convective Initiation Case
“Typical Summer Conditions” Mid/upper ridge centered to the north. (below) Low-level southeast flow off of the Gulf. .5 degree radial velocity 6/28 (15Z) (top) 6/28 (12Z) 500mb geopotential height (m) (right)
SPoRT 6/28/18Z Level II Radar Reflectivity vs. SPoRT WRF Contoured Reflectivity
SPoRT 6/28/21Z Level II Radar Reflectivity vs. SPoRT WRF Contoured Reflectivity
Control 6/28/21Z Level II Radar Reflectivity vs. Control WRF Contoured Reflectivity
Sea/bay breeze SPoRT 22Z outflow 1st and 2nd generation convection, with sea/bay breeze in yellow
Surface Vegetation SPoRT 6/28 Surface Vegetation Control 6/28 Large differences in vegetation initialization SPoRT vs. Control runs
SFC Temp SPoRT 6/28/18Z SFC Temp Control 6/28/18Z warmer Warmer far inland afternoon/evening temperatures from SPoRT run vs. Control run
References Case, J. L., F. J. LaFontaine, S. V. Kumar, and G. J. Jedlovec, 2011: A real-time MODIS vegetation composite for land surface models and short-term forecasting. Preprints, 15th Symp. on Integrated Observing and Assimilation Systems for the Atmosphere, Oceans and Land Surface, Seattle, WA, Amer. Meteor. Soc., 11.2. Available online athttp://ams.confex.com/ams/91Annual/webprogram/Manuscript/Paper180639/Case_etal_2011AMS-15IOAS-AOLS_11.2_FINAL.pdf] Case. J. L., F. J. LaFontaine, S. V. Kumar, and C. D. Peters-Lidard, 2012: Using the NASA-Unified WRF to assess the impacts of real-time vegetation on simulations of severe weather. Preprints, 13th Annual WRF Users’ Workshop, P69. [Available online athttps://www.regonline.com/AttendeeDocuments/1077122/43418383/43418383_1045166.pdf] Case. J. L., F. J. LaFontaine, J. R. Bell, G. J. Jedlovec, S. V. Kumar, and C. D. Peters-Lidard, 2012: A real-time MODIS vegetation product for land surface and numerical weather prediction models. EEE Trans. Geosci. Remote Sens., In Review. Haines, S. L., G. J. Jedlovec, and S. M. Lazarus, 2007: A MODIS sea surface temperature composite for regional applications.IEEE Trans. Geosci. Remote Sens., 45, 2919–2927. LaCasse, K. M., M. E. Splitt, S. M. Lazarus, and W. M. Lapenta, 2008: The impact of high-resolution sea surface temperatures on the simulated nocturnal Florida marine boundary ayer. Mon. Wea. Rev.,136, 1349–1372. Schiferl, L., K. K. Fuell, J. L. Case, and G. J. Jedlovec, 2010: Evaluation of enhanced high resolution MODIS/AMSR-E SSTs and the impact on regional weather forecasts. Preprints, 14th Symp. on Integrated Observing and Assimilation Systems for the Atmosphere, Oceans, and Land Surface, Atlanta, GA, Amer. Meteor. Soc., P535. [Available online at http://ams.confex.com/ams/pdfpapers/163774.pdf.] Case, J. L., W. L. Crosson, S. V. Kumar, W. M. Lapenta, and C. D. Peters-Lidard, 2008: Impacts of high-resolution land surface initialization on regional sensible weather forecasts from the WRF model. J. Hydrometeor., 9, 1249-1266. Case, J. L., S. V. Kumar, J. Srikishen, and G. J. Jedlovec, 2011: Improving numerical weather predictions of summertime precipitation over the southeastern United States through a high resolution initialization of the surface state. Wea. Forecasting,26, 785-807. Kumar, S. V., and Coauthors, 2006. Land Information System - An Interoperable Framework for High Resolution Land Surface Modeling. Environmental Modeling & Software,21 (10), 1402-1415, doi:10.1016/j.envsoft.2005.07.004. Peters-Lidard, C. D., and Coauthors, 2007: High-performance Earth system modeling with NASA/GSFC’s Land Information System. Innovations Syst. Softw. Eng.,3, 157-165.